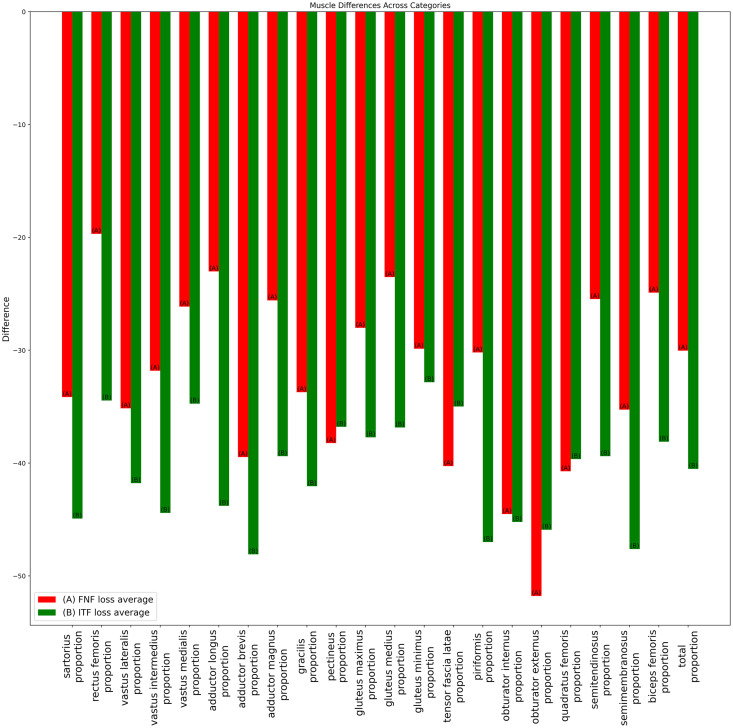
Figure 8. Bar chart of average muscle volume difference ratio across fracture types in combined-gender groups.
The ratios of average individual muscle volume differences for gender-combined groups, comparing pre-operative and post-operative results. Ratios were calculated by dividing the difference between pre- and post-operative results by the pre-operative volume. Red (A) bars denote the femoral neck fracture group, while green (B) bars represent the intertrochanteric fracture group.

