. 2023 Nov 10;34(8):1141–1160. doi: 10.1080/09602011.2023.2275825

Figure 2.

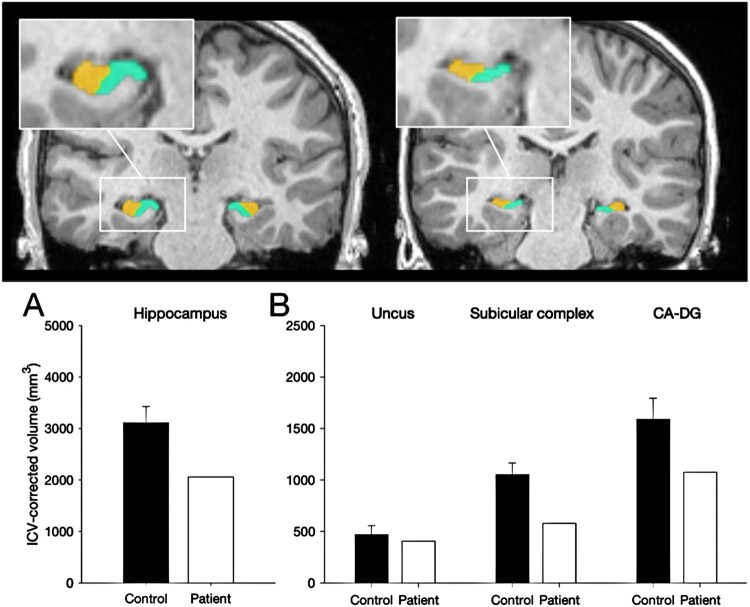
Top: A coronal section of a T1-weighted MRI scan. Manual segmentation of hippocampal subregions highlights reduced volumes in the patient compared to a control. Below Left: Hippocampal volume of a control participant is plotted beside the volume from the patient. Below Right, ICV-corrected volumes of hippocampal subregions are plotted to show reduced volumes in the patient compared to controls.

Manual segmentation of the hippocampus. Top: 3T-MRI scan of a 14-year-old male control participant (left) alongside Patient H (right) showing the reduced volume of the subicular complex (in green) and CA-DG region in (orange). Bottom. ICV-corrected hippocampal volumes for Patient H compared with 32 healthy controls (8y – 38y; 16male) indicating a 34% volume atrophy of the hippocampus.