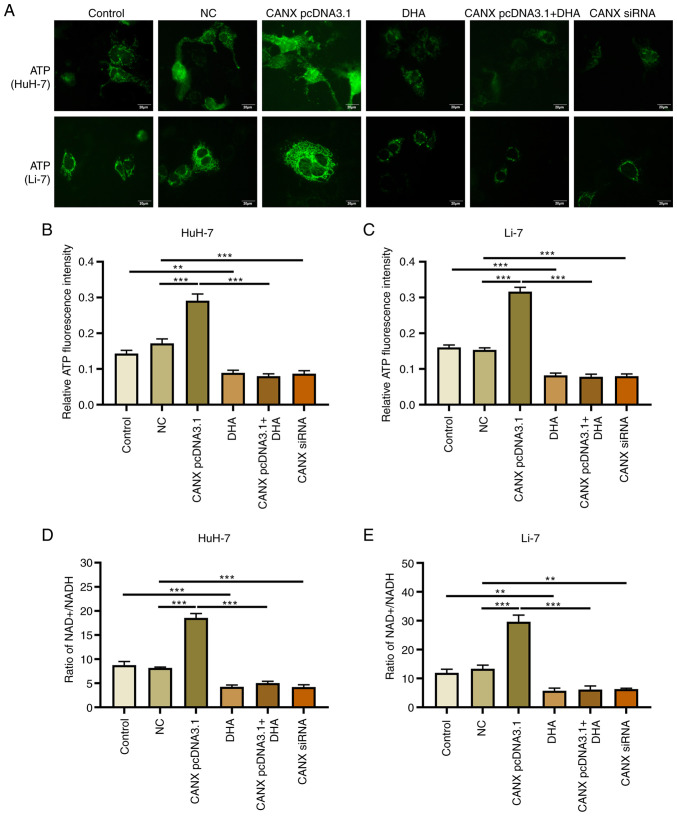
Figure 5.
Effects of CANX and DHA on mitochondrial ATP production and the NAD+/NADH ratio. (A) ATP fluorescence intensity probe detected ATP fluorescence intensity of HuH-7 and Li-7 cells after CANX knockout, DHA or CANX overexpression. Level of ATP fluorescence intensity in (B) HuH-7 and (C) Li-7 cells, quantified using Image-Pro Plus 6.0 software. Ratio of NAD+ and NADH content in (D) HuH-7 and (E) Li-7 cells after CANX knockout, DHA or CANX overexpression (scale bar, 20 µm), **P<0.01; ***P<0.001. CANX, calnexin; DHA, dihydroartemisinin; NC, negative control; siRNA, small interfering RNA.

