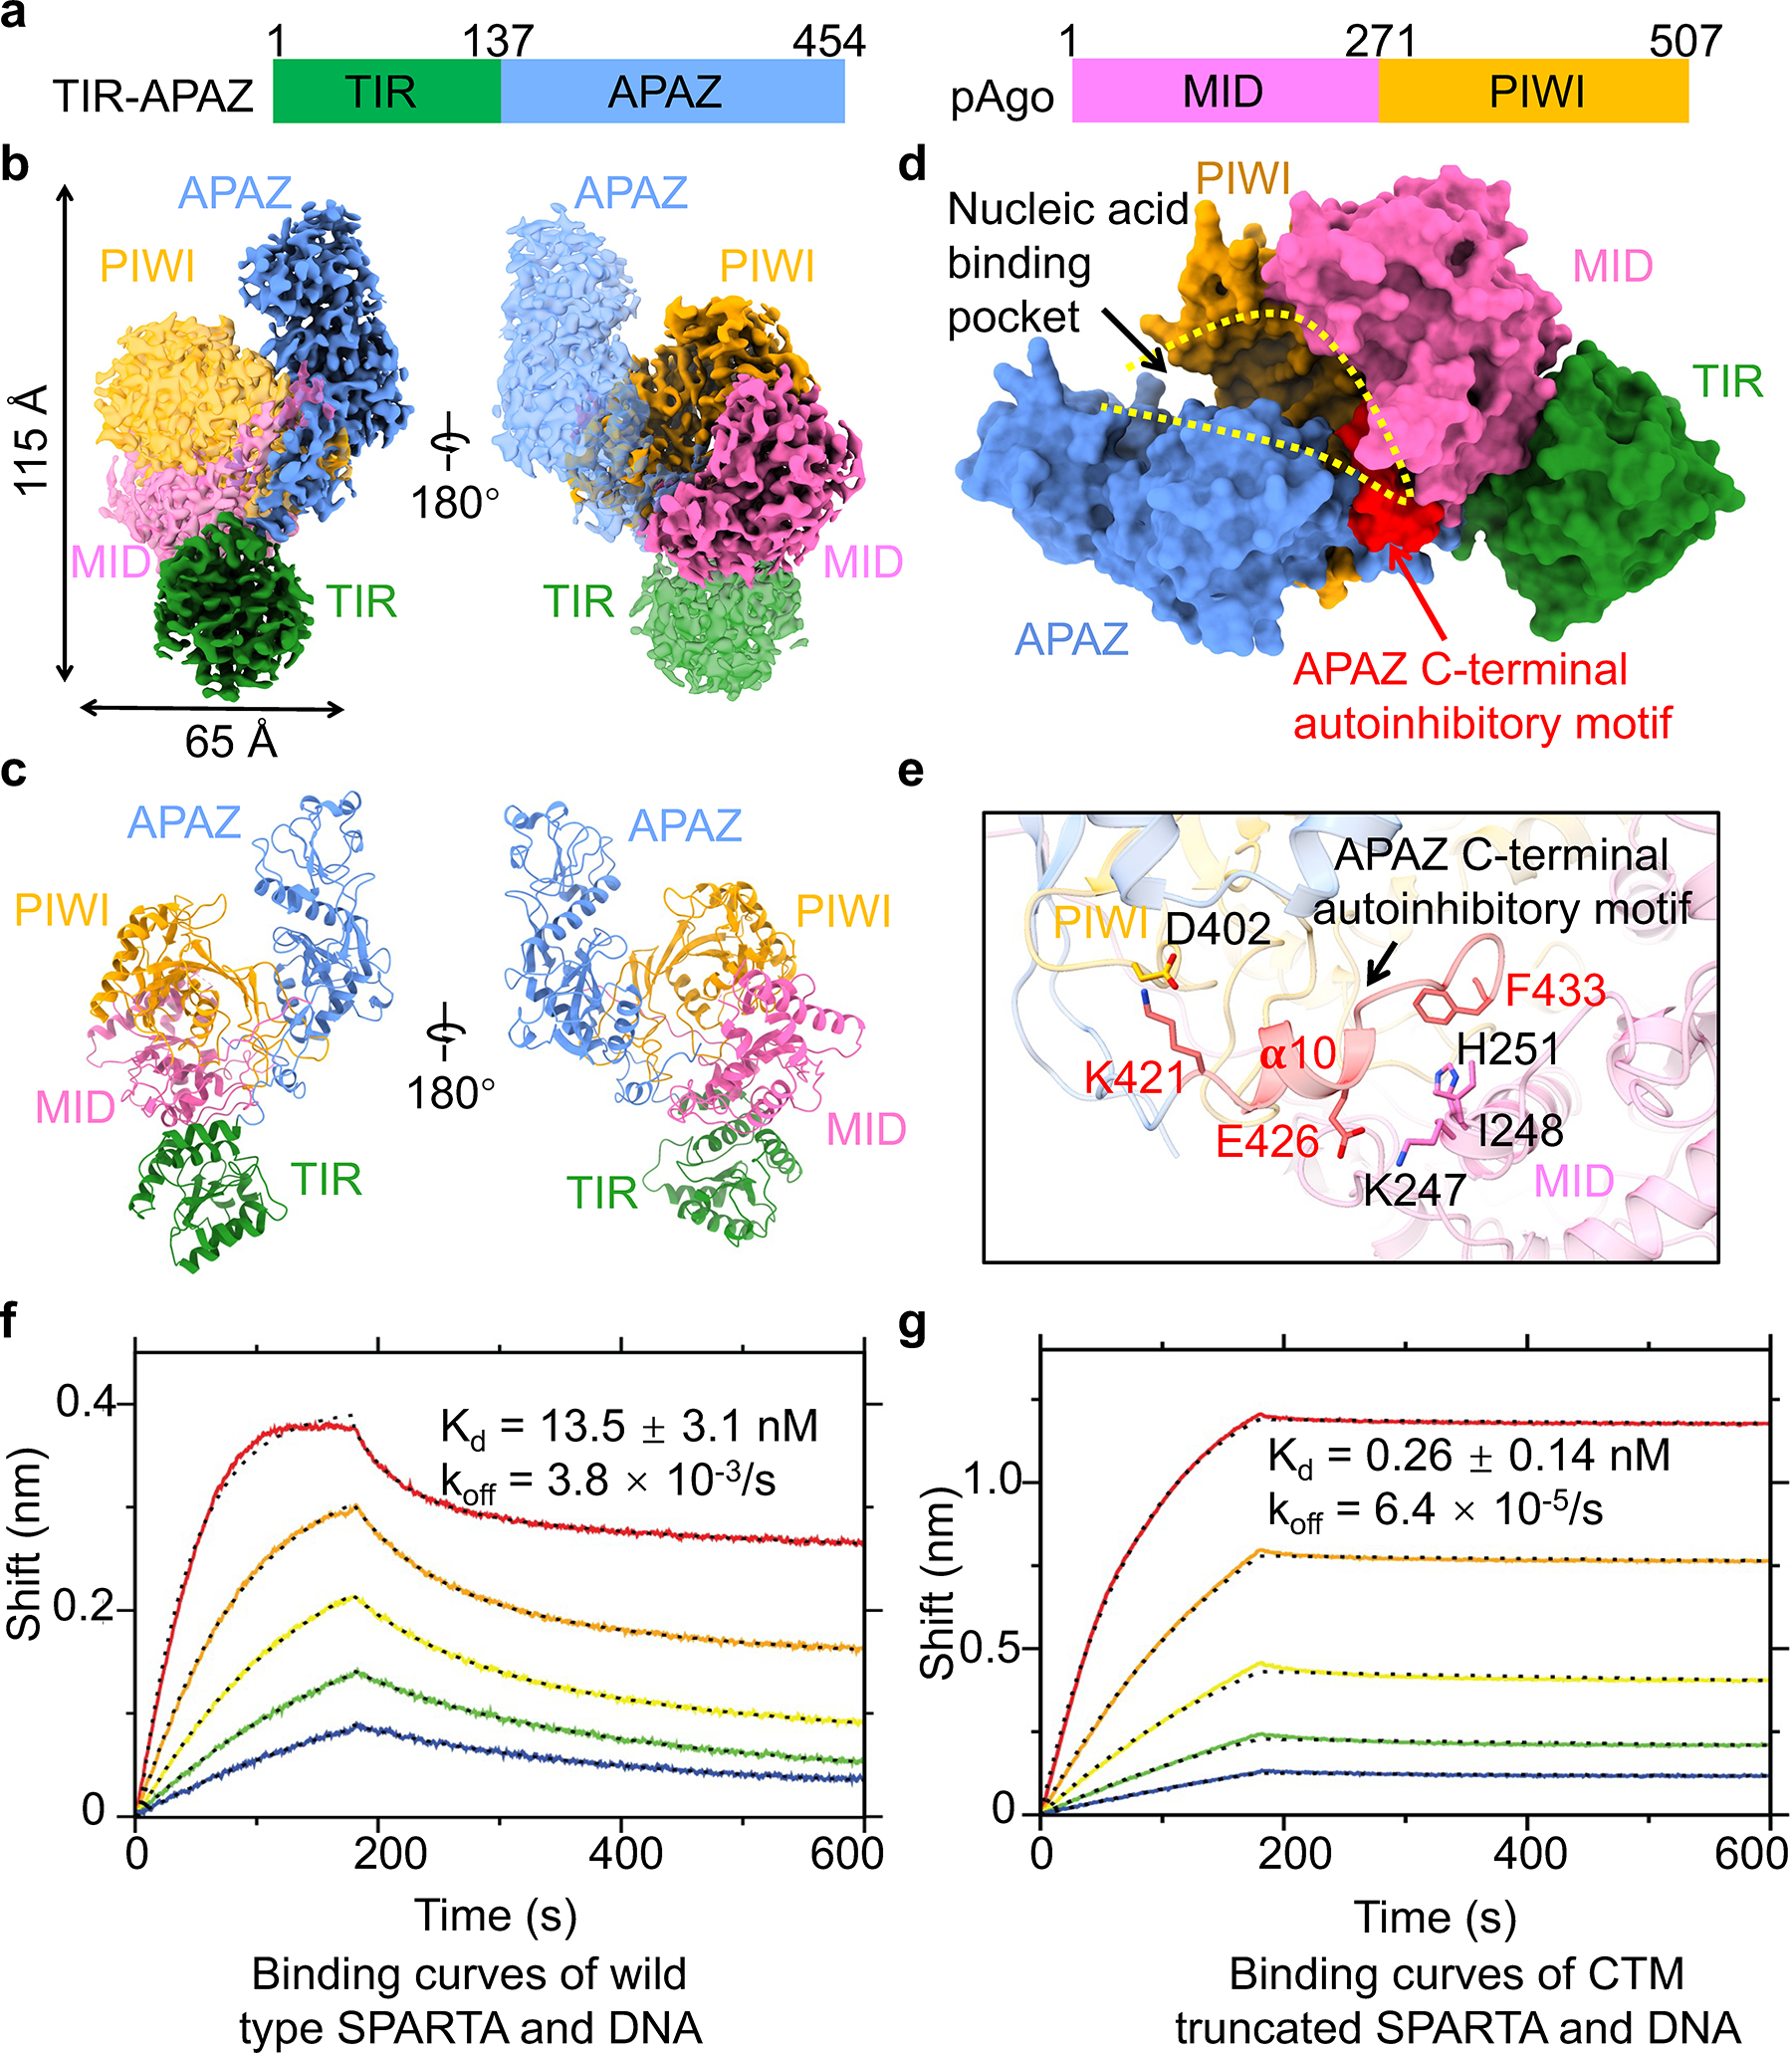
Fig. 1 |. Apo monomeric MapSPARTA.

a, Domain architecture of TIR-APAZ and pAgo that together form MapSPARTA. The TIR domain is indicated in green, APZA blue, MID in magenta, and PIWI in yellow.
b, c, Cryo-EM density map (b) and ribbon diagrams (c) of apo monomeric MapSPARTA with domains colored as in a.
d, Surface representation of apo monomeric MapSPARTA with the nucleic acid-binding pocket indicated with yellow dashed lines and the auto-inhibitory C-terminal motif (CTM) of APAZ shown in red.
e, Detailed interactions between APAZ CTM and pAgo.
f, g, BLI sensorgrams of wildtype (f) and C-terminal motif (CTM)-truncated MapSPARTA (g) binding the target DNA. From top curve to bottom, the proteins were two-fold serial dilutions from 50 nM.
