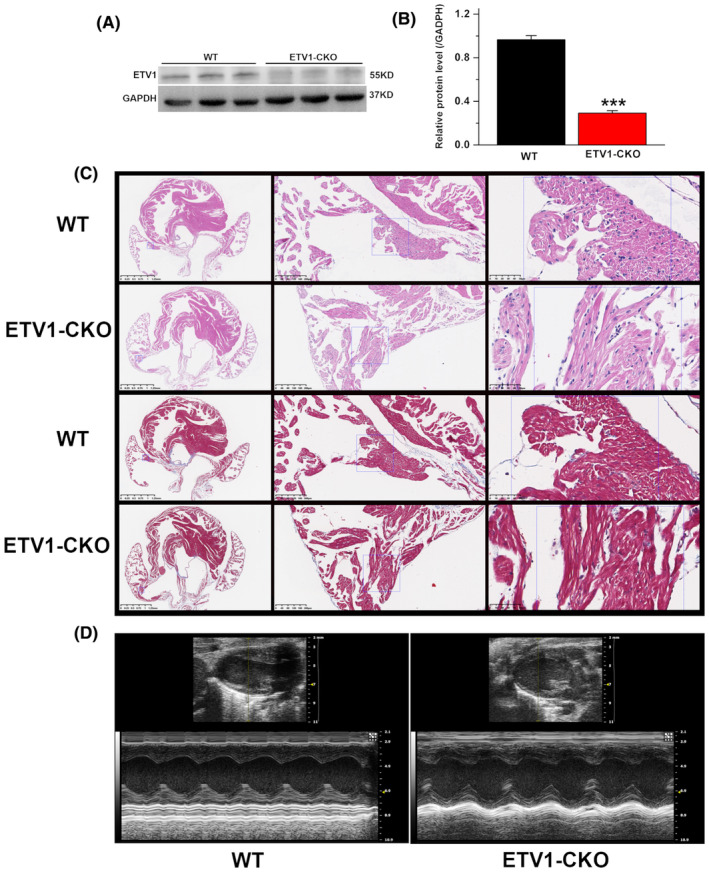
FIGURE 1.

Cardiomyocyte morphology of specific ETV1‐CKO mice. (A, B) Protein level of ETV1 in the atria of the two groups mice. Molecular weight on western blot: ETV1 ~55 kDa (values are presented as mean ± SD. n = 3, ***p < 0.001 vs. WT, by student's t‐test). (C) Heart tissue of two groups. Haematoxylin and eosin staining showed no significant morphological differences in cardiac four lumen sections between ETV1‐CKO and WT mice. Masson staining showed no evidence of atrial fibrosis (n = 3 per group at 16–20 weeks old, scale bars of the left is 1.25 mm, the middle is 200 μm, the right row of rulers is 50 μm). (D) Representative M‐mode images showing systolic excursion of LV walls in ETV1‐CKO mice (left), indicating reduced systolic function compared with their WT littermates (right).
