
FIGURE 2.
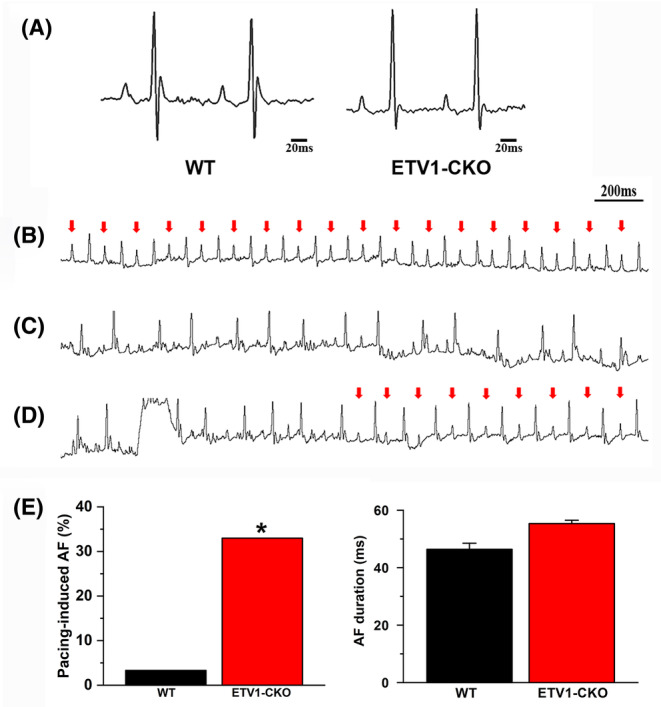
ECG before and after rapid inducing in ETV1‐CKO mice. (A) Representative recordings of surface ECG lead II showing no change in baseline ECG parameters comparing 4‐month‐old ETV1‐CKO and WT mice. (B) Red arrows showed sinus rhythm. (C) Induced AF. (D) Spontaneously restore sinus rhythm from AF. (E) Bar graph summarizing the incidence of inducible AF in ETV1‐CKO mice. Data were analysed using Fisher's exact test (*p < 0.05 vs. WT). No difference was found in duration of AF between two groups (n = 40 mice for Etv1f/fMyHCCre/+ and n = 30 mice for control).