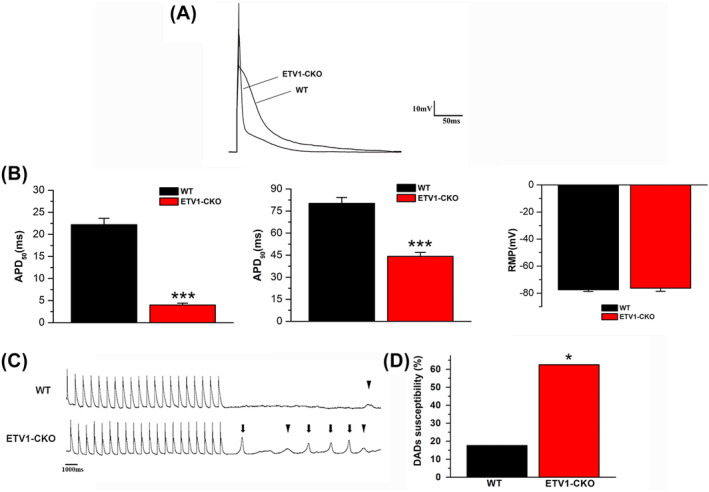
FIGURE 3.

Action potential maps, DADs and TA plots of atrial myocytes in both groups. (A) Original plots of two groups of action potentials. (B) APD50 and APD90 were significantly shortened in the ETV1‐CKO group compared with the WT group (n = 16/3 cells/mice for Etv1f/fMyHCCre/+ and n = 17/3 cells/mice for control, ***p < 0.001 vs. WT, by student's t‐test). No difference was found in RMP between two groups. (C) The action potentials DAD (▼) and spontaneous AP (↓) recorded in WT and ETV1‐CKO groups, respectively. (D) Increased atrial myocyte DADs in the ETV1‐CKO versus WT groups (n = 16/3 cells/mice for Etv1f/fMyHCCre/+ and n = 17/3 cells/mice for control, *p < 0.05 vs. WT, by student's t‐test).
