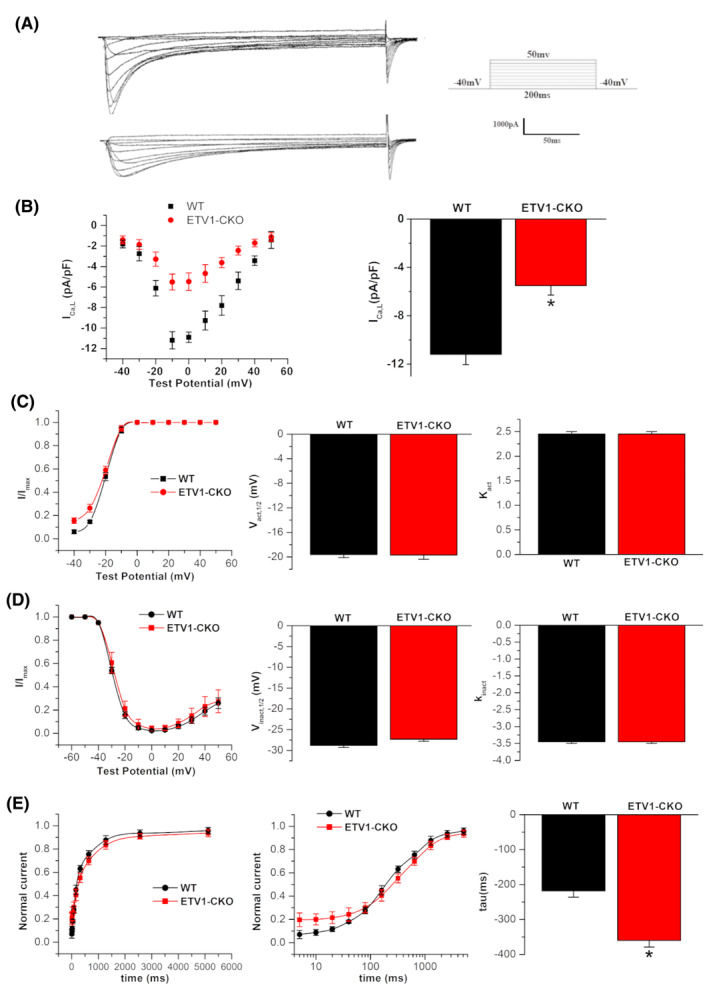
FIGURE 4.

L‐calcium currents and the alteration of gating dynamics of I Ca,L in atrial myocytes in both groups. (A) Raw diagram of L‐type calcium current in two groups. (B) I–V relationship curve of L‐type calcium currents recorded from Etv1f/fMyHCCre/+ (n = 17/6 cells/mice) and control (n = 15/6 cells/mice) atrial cardiomyocytes. The amplitudes of L‐type calcium current were normalized to cell capacitance and presented as mean ± SD. I–V current curve showed “inverted bell type” in two groups. The bar plot illustrates comparison of peak of I Ca,L density between two groups (*p < 0.05 vs. WT, by student's t‐test). (C, D) Steady‐state activation and inactivation curves, semi‐activation (half‐inactivation) voltage and curve slope (n = 17/6 cells/mice for Etv1f/fMyHCCre/+ and n = 15/6 cells/mice for control). (E) Time course of recovery from inactivation, the tau value was significantly longer in ETV1‐CKO group as compared with the WT group (n = 16/6 cells/mice for Etv1f/fMyHCCre/+ and n = 13/6 cells/mice for control) (*p < 0.05 vs. WT, by student's t‐test).
