
FIGURE 7.
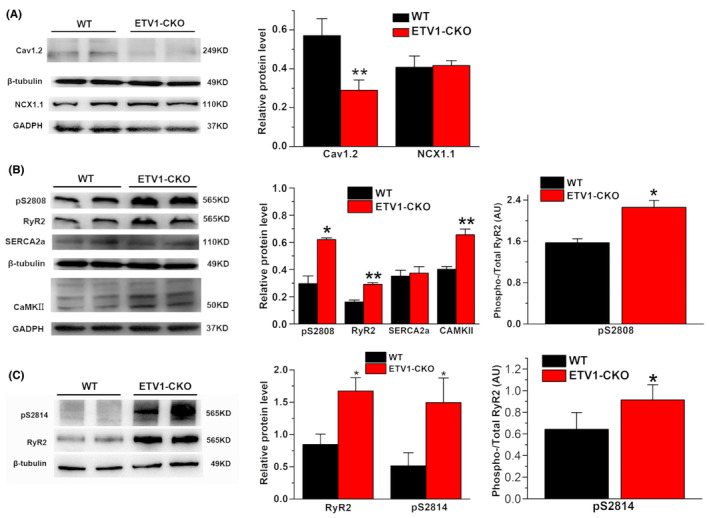
Calcium channel (A) and transporter protein (B,C) expressing in the atria of the two groups. Molecular weight on western blot: Cav1.2 ~249 kDa, NCX1.1 ~110 kDa, p‐RyR2 (S2808 and S2814) ~565 kDa, RyR2 ~565 kDa, SERCA2a ~110 kDa, CaMKII ~50 kDa, β‐tubulin ~49 kDa, and GAPDH ~37 kDa. (Values are presented as mean ± SD. n = 3, *p < 0.05 vs. WT, **p < 0.01 vs. WT, by student's t‐test).