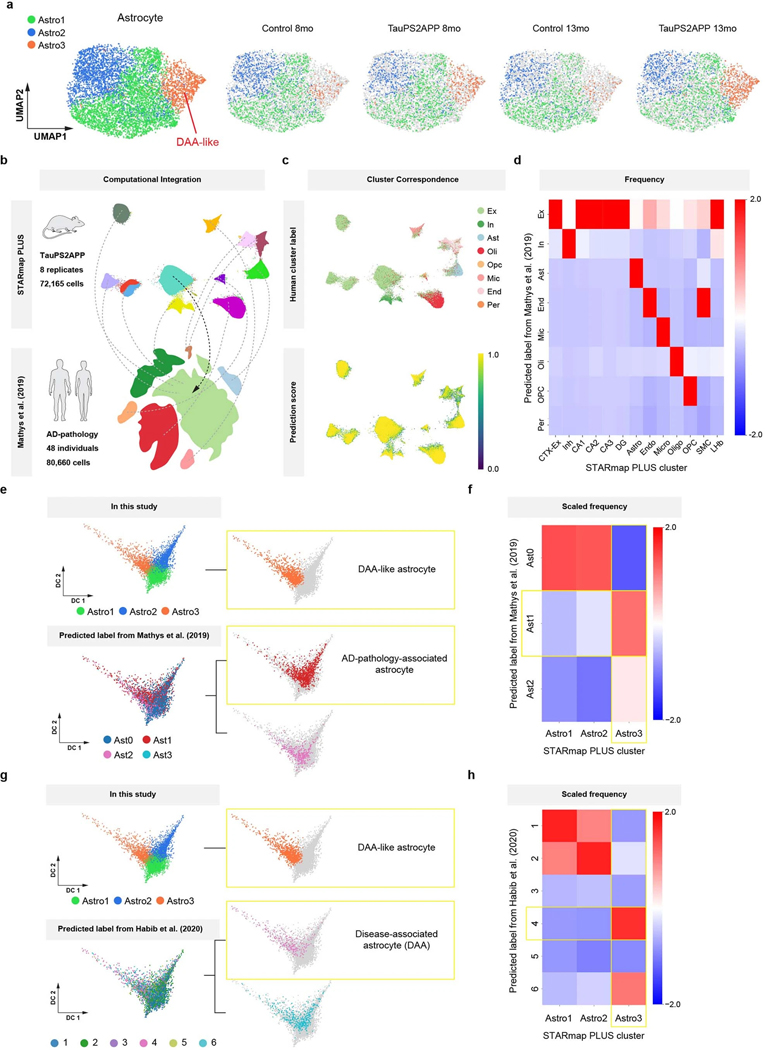
Extended Data Fig. 5 |. Identification of disease-associated astrocyte populations in TauPS2APP mouse model through comparative studies with other AD mouse models and human patient samples.
a, UMAP showing three subclusters of 6,789 astrocytes across samples. b, Schematic plot showing the basic idea of CCA integration and label transfer. In total, 72,165 cells from TauPS2APP and control mice were integrated with 80,660 cells from 48 human individuals with or without AD pathology in Mathys et al12. c, UMAPs showing the predicted labels (top) and scores (bottom) of STARmap PLUS cells generated by the CCA integration with cells from Mathys et al12. d, Heatmap showing the proportions (color bar, scaled per column) of cluster IDs from Mathys et al12. (rows) mapped to STARmap PLUS cells (columns). Cells were excluded if their label prediction score were less than 0.5. e, Diffusion maps showing the subpopulation identified by the present study (top) and predicted labels generated by the CCA integration with the astrocyte population from Mathys et al12. (bottom). f, Heatmap showing the proportions (color bar, scaled per column) of astrocyte cluster IDs from Mathys et al. (rows) mapped to STARmap PLUS astrocyte subpopulations (columns). Cells were excluded if their label prediction score were less than 0.5. g, Diffusion maps showing the subpopulation identified by the present study (top) and predicted labels generated by the CCA integration with the astrocyte population from Habib et al9. (bottom). h, Heatmap showing the proportions (color bar, scaled per column) of astrocyte cluster IDs from Habib et al9. (rows) mapped to STARmap PLUS astrocyte subpopulations (columns). Cells were excluded if their label prediction score were less than 0.5.

