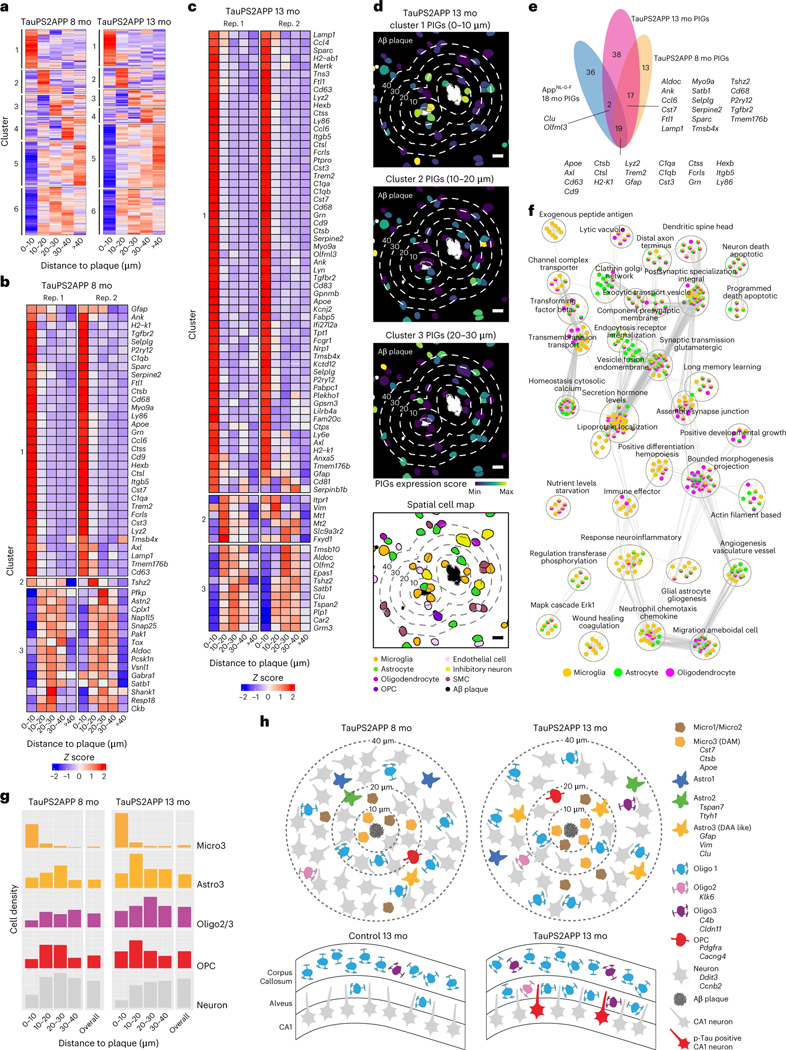
Fig. 7 |. Integrative spatiotemporal analysis of disease-associated cell types and gene programs.
a, Matrix plot showing the gene clustering results in each distance interval around the Aβ plaque in TauPS2APP 8-month samples (left) and TauPS2APP 13-month samples (right). Colored by row-wise z score. b,c, Matrix plot showing the PIGs (enriched in 0–30 μm interval, adjusted P < 0.05) in each distance interval around the Aβ plaque in TauPS2APP 8-month sample (b) and TauPS2APP 13-month sample (c). Colored by row-wise z score. d, Representative images showing the spatial pattern of the gene set score for three spatial DEG clusters and corresponding cell type composition around plaque in the TauPS2APP mice at 13 months. Five concentric boundaries that are 10, 20, 30, 40 and 50 μm from each plaque were generated to quantify the cell type composition of each layer. Scale bar, 10 μm. e, Venn diagram highlighting the overlap of SDEGs in the TauPS2APP 8- and 13-month samples with SDEGs in TauPS2APP and previously reported PIGs in 18-month AppNL-G-F mice. f, An enrichment map showing the substantially enriched GO terms of cell type resolved SDEGs of microglia, astrocyte and oligodendrocyte in the TauPS2APP 13-month samples. Nodes represent the enriched GO terms; the size of each node corresponds to the number of genes in the GO terms (gProfiler term threshold: Fisher’s one-tailed test, P < 0.05; cytoscape node cut-off: FDR q < 0.1). Edges between nodes represent overlapping genes between two GO terms. Clusters with less than five nodes are filtered out. g, Histograms of Micro3, Astro3, Oligo2/Oligo3, OPC and neuronal cells spatial distribution around Aβ plaque in the TauPS2APP 8-month sample (left) and 13-month sample (right). h, Schematic diagram showing the spatial distribution of different cell types around Aβ plaque (top) and oligodendrocyte subtypes in hippocampal alveus (bottom) in the TauPS2APP mouse model. The number of cells in the schematic diagram represents the approximate ratio of cell number for each cell type.

