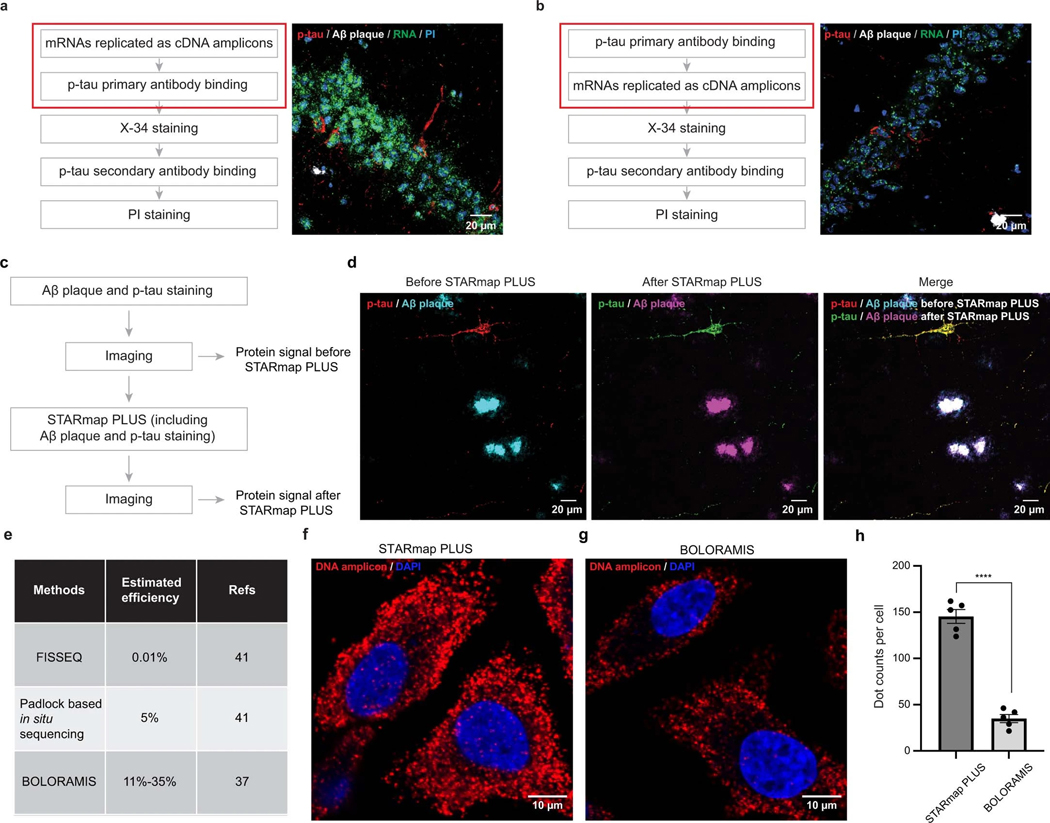
Extended Data Fig. 1 |. Development of the STARmap PLUS method.
a, Flow chart of STARmap PLUS procedure where p-tau primary antibody staining was performed after mRNA in situ hybridization and amplification. The imaging results showed strong signals from both cDNA amplicons and proteins (N = 2 independent experiments). b, Alternative procedure where the p-tau primary antibody staining was conducted before mRNA in situ hybridization and amplification. The imaging results showed a much weaker signal from cDNA amplicons, suggesting RNA degradation during antibody incubation and washing steps (N = 2 independent experiments). PI staining, propidium iodide staining of cell nuclei. c, Schematic diagram of the experimental design to test if the tissue retains the same structure after STARmap PLUS. d, The imaging result before STARmap PLUS (left), after STARmap PLUS (middle), and overlay (right) of p-tau and Aβ-plaque signals were recorded (N = 2 independent experiments). e, Summary of the detection efficiency of RCA-based spatial transcriptomics methods. The efficiency of FISSEQ and padlock based in situ sequencing was extracted from Lein et al.41, and the efficiency of BOLORAMIS was extracted from Liu et al. 37. f,g, The ACTB mRNA signal detected by STARmap PLUS (f) and BOLORAMIS37 (g) in Hela cells. h, Quantification of the number of DNA amplicons per cell identified by STARmap PLUS and BOLORAMIS. Error bars, standard deviation. Data are presented as mean ± s.e.m, n = 5 images per condition. Two-sided Student’s t-test, ****P = 1.39×10⁻⁶.

