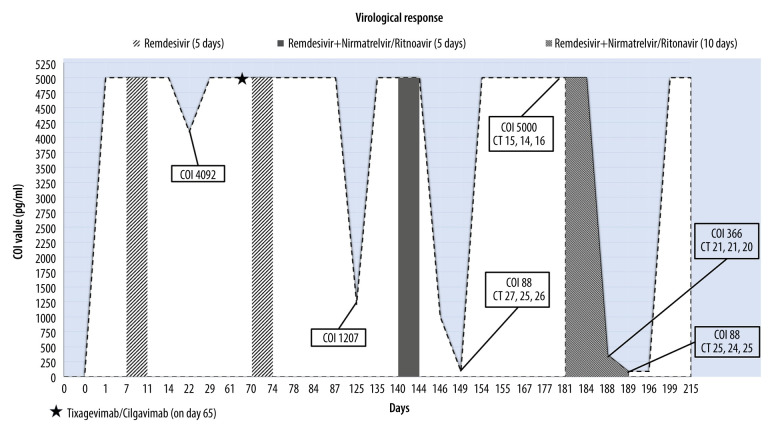
Figure 2.
The virological response is expressed with the cut off index (COI) on the Y axis. Significant values are reported in the tables, with COI value and cycle threshold (Ct) values. This figure shows the trend of the virological response during 3 different anti-SARS-CoV-2 therapeutic regimens to which our immunocompromised patient was subjected. In chronological order, the following were administered: a 5-day cycle of remdesivir twice in a 2-month period, a single administration of tixagevimab/cilgavimab, a cycle of combined therapy of remdesivir and nirmatrelvir/ritonavir (Paxlovid), and finally, a 10-day cycle of remdesivir and nirmatrelvir/ritonavir (Paxlovid). The graph shows significant reduction in viral load following a combined or prolonged regimen of remdesivir and nirmatrelvir/ritonavir.

