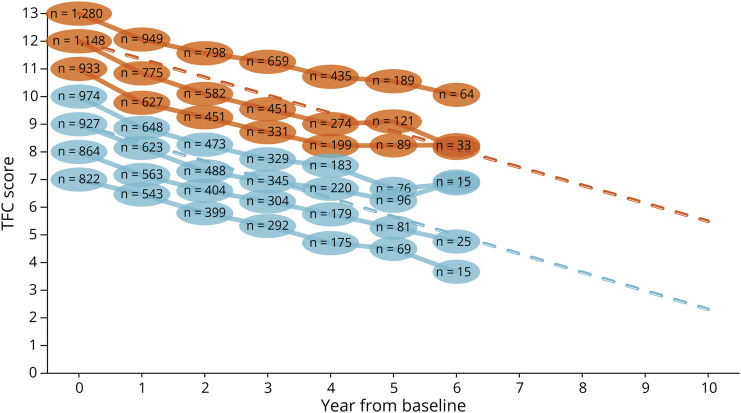
Figure 2. Natural History of HD.
The ovals are the observed means from Enroll-HD19 at each visit, with the sample size indicated at each time point. Dashed lines indicate the simple linear regression extrapolations based on 3-year TRACK-HD16,17 average TFC progression for motor-manifest HD (UHDRS DCL = 4). n = number of individuals per average score in Enroll-HD; TFC = total functional capacity.

