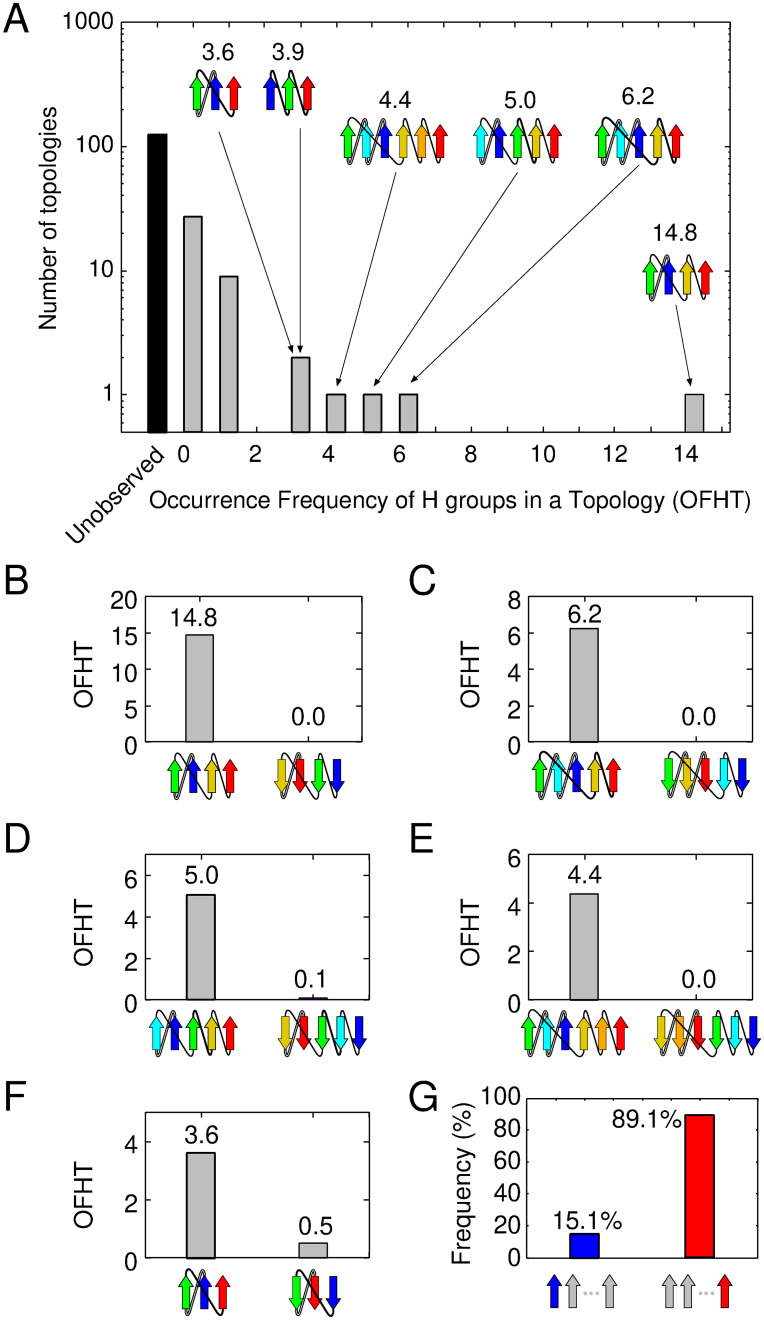
Fig 1. Occurrence frequency of homologous-group in a topology (OFHT) for each topology in the ECOD database.
(A) It presents the distribution of pure parallel β-sheet topologies. The inset shows the topology diagrams of superfolds. Gray and black bars represent observed and unobserved topologies, respectively. (B)-(F) These panels depict the occurrence frequency of a superfold (on the left) and its reverse topology (on the right). (G) This panel calculates the probabilities of the N- and C-terminal β-strand being positioned at the edge of the β-sheet for all observed topologies.

