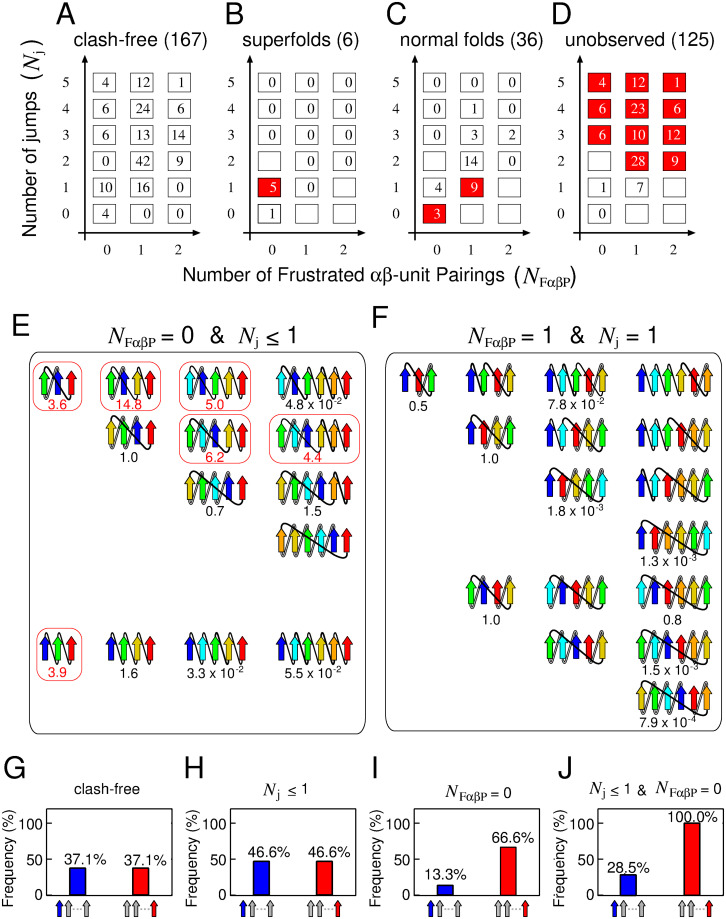
Fig 3. Topologies categorized by NFαβP and Nj.
(A)-(D): The number of topologies for theoretically possible clash-free states, superfolds, normal folds, and unobserved folds, depicted on a two-dimensional grid. The states highlighted in red indicate instances where more than 50% of the total number of theoretically possible clash-free topologies are observed. (E)-(F): Topology diagrams in the states (NFαβP = 0, Nj ≤ 1) and (NFαβP = 1, Nj = 1). The numbers below the topology diagrams represent their OFHTs. Topology diagrams surrounded by a red box represent superfolds. (G)-(J): The probabilities of the N- or C-terminal β-strand being at the edge of the β-sheet calculated from clash-free topologies, topologies with (Nj ≤ 1), those with (NFαβP = 0), and those with (Nj ≤ 1, NFαβP = 0).

