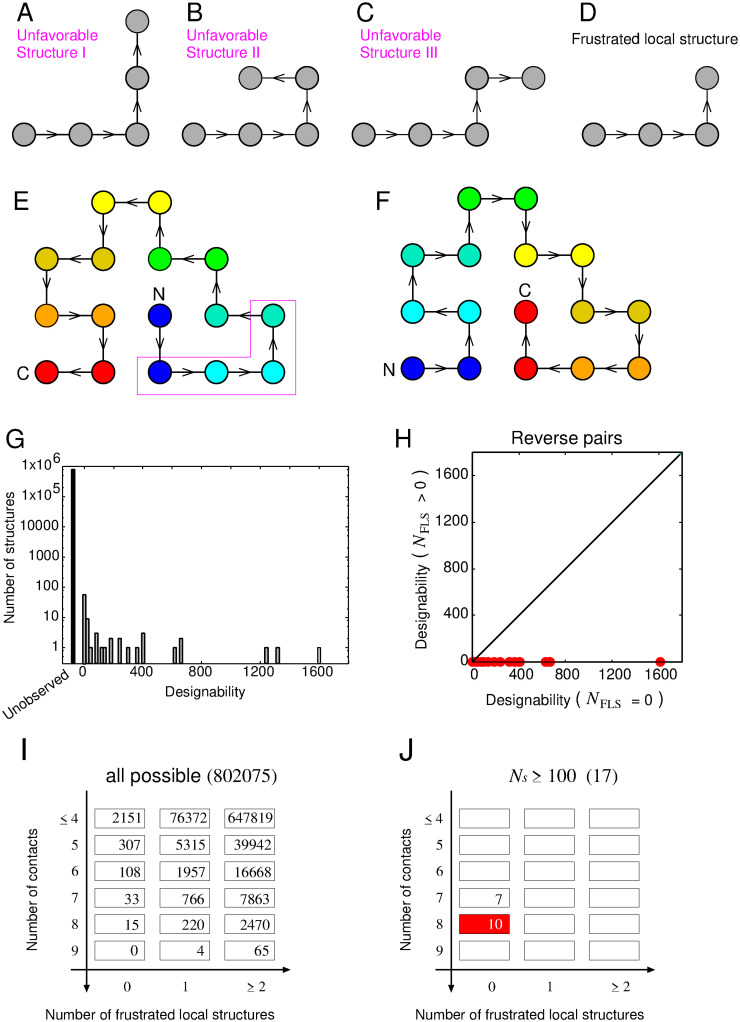
Fig 4. The lattice protein model employed in this study.
(A)-(C) Depict three structures defined as physically unfavorable. Each filled gray circle symbolizes a single residue. Black lines with arrows depict covalent bonds; the arrows indicate the the N- to the C-terminal chain direction. (D) Represents a frustrated local structure (FLS), a local structure that necessarily contains one of the three physically unfavorable structures. (E) Provides an example of a structure containing an FLS. Rainbow coloring from blue to red indicates the N- to C-terminal position of the residues in the model. (F) Illustrates the reverse structure of (E), which does not contain an FLS. (G) Shows a histogram of designability for the lattice model with the local interactions. (H) Displays designabilities of structure pairs, where one is a structure that does not contain an FLS and the other is its reverse structure that does. (I)-(J) Illustrates the number of all possible structures and highly designable structures mapped onto the two-dimensional grid, NFαβP and NFLS.

