
Figure 7.
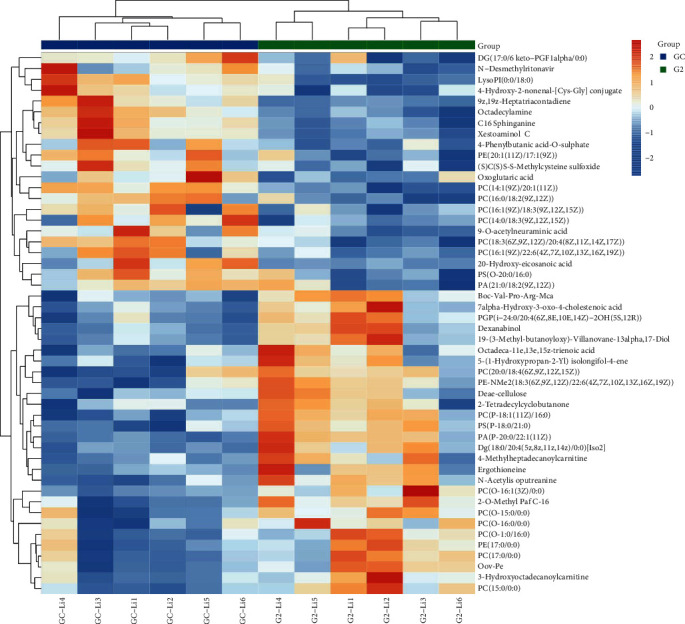
The heatmap illustrates the unsupervised hierarchical clustering in Nile tilapia, displaying the changes in metabolite levels relative to the median metabolite level. GC, control diet group with no probiotics and G2, 108 cfu/g of B. amyloliquefaciens AV5. Note: The reader is directed to the Web version of this study for a description of the color references in this figure's legend.