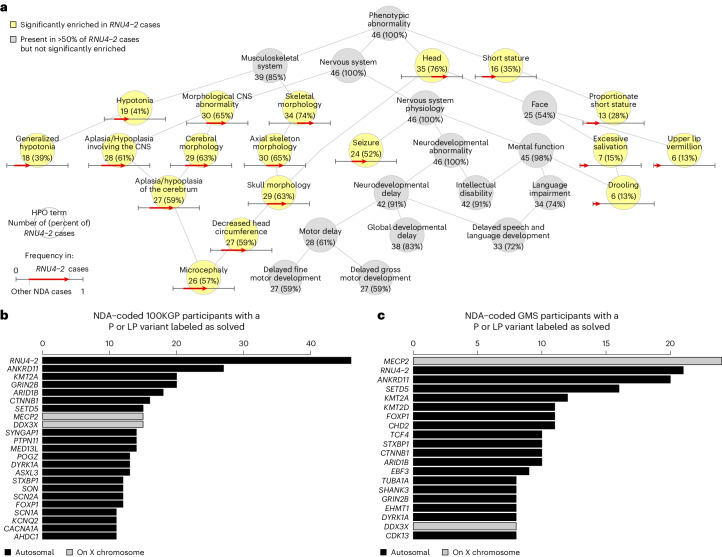
Fig. 2. Phenotypic characterization and prevalence of a novel neurological disorder.
a, Graph showing the is-a relationships among HPO terms present in at least half of the 46 NDA-coded RNU4-2 cases identified or significantly enriched among these 46 cases relative to 9,112 other unrelated NDA-coded participants of the 100KGP. Terms are shortened to remove ‘Abnormality of (the)’ or ‘Abnormal’ for conciseness. The significantly overrepresented terms are highlighted. For each term, the number of cases with the term and the percentage that number represents out of 46 is shown. For each overrepresented term, the proportion of NDA-coded participants that are not RNU4-2 cases with the term and the proportion of NDA-coded RNU4-2 cases with the term are represented as the base and the head of an arrow, respectively. b, Of the 9,112 NDA-coded cases in the 100KGP, the number solved through P or LP variants in a gene, provided at least 11 cases were diagnosed. In the case of RNU4-2, the number of NDA-coded cases with a rare variant in the highlighted region of Fig. 1d is shown instead of the number solved with P or LP variants. c, Of the 5,527 NDA-coded cases in the GMS, the number solved through P or LP variants in a gene, provided at least eight cases were diagnosed. In the case of RNU4-2, the number of NDA-coded cases with a rare variant in the highlighted region of Fig. 1d is shown instead of the number solved with P or LP variants.

