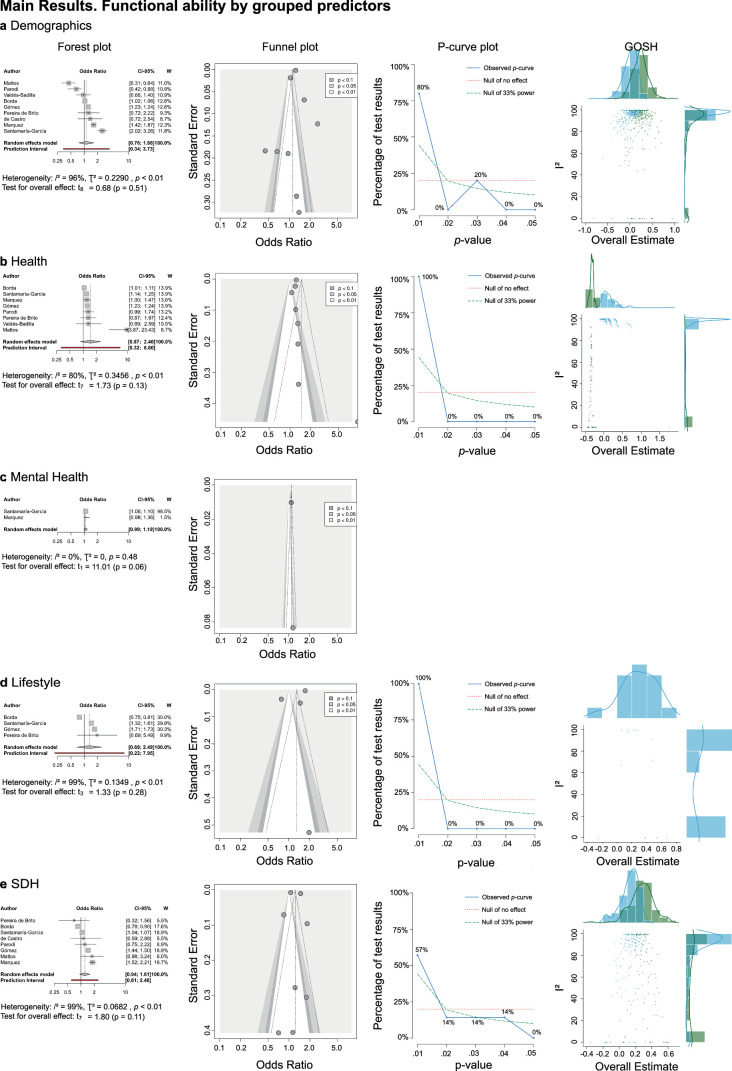
Extended Data Fig. 2. Metanalysis across different risk factors for functional ability.
Each panel illustrates the major effects for each factor analyzed: panel a focuses on demographics; panel b on health; panel c on mental health; panel d on lifestyle; and panel e on Social Determinants of Health (SDH). The forest plot shows k studies using the random effects model (first author, odds ratio, confidence interval, and weights). Information on the P-curve and GOSH plot was not displayed in panel c due to a reduced number of studies available for conducting specific analyses. The random effects model results (Demographics: k = 9, n = 99120, OR = 1.1232, p-value = 0.5132, CI = [0.7593; 1.6613]; Health: k = 8, n = 98992, OR = 1.4634, p-value = 0.1264, CI = [0.8708; 2.4595]; Mental health symptoms: k = 2, n = 49257, OR = 1.083, p-value = 0.0577, CI = [0.9878; 1.874]; Lifestyle: k = 4, n = 80130, OR = 1.3086, p-value = 0.2756, CI = [0.6875; 2.4906]; SDH: k = 8, n = 98793, OR = 1.2273, p-value = 0.1144, CI = [0.9382; 1.6055]) are reported with Knapp-Hartung correction for false discovery rate, the prediction interval, and heterogeneity values (I², tau²). Contour-enhanced funnel plot showing effect sizes, standard errors, and significance. P-curve analysis, showing the accumulation of p-values over the significant studies (observed p-curve), the no-effect curve, and the 33% power curve. GOSH (Graphic Display of Heterogeneity) shows the distribution for all 2k-1 possible study combinations (1 million randomly selected models when 2k-1 > 106) in blue and leaving out the most negatively influential study in green. Blank panels indicate that P-Curves and GOSH cannot be estimated due to insufficient studies.

