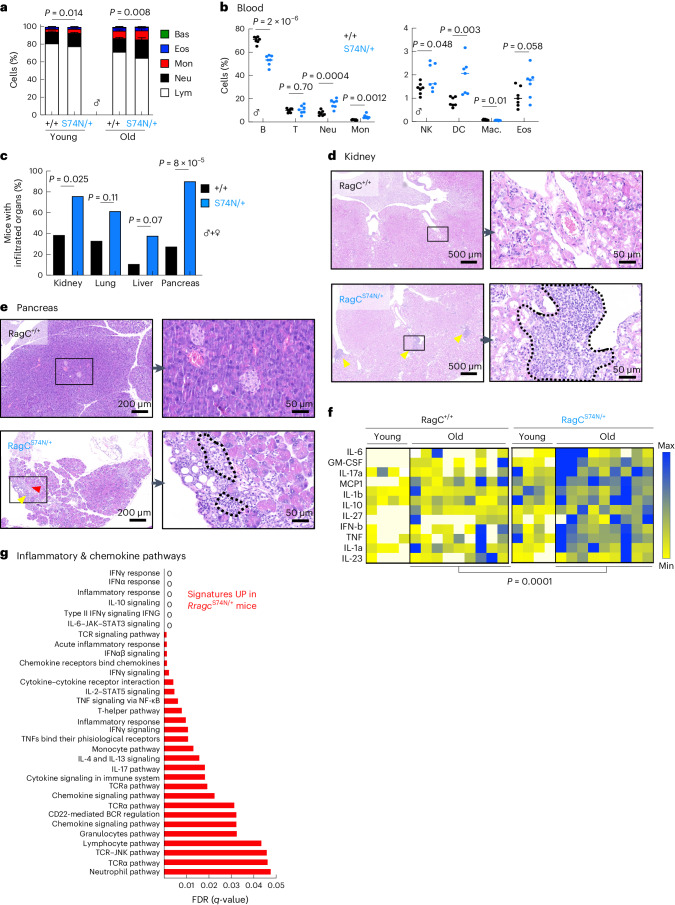
Fig. 2. Old Rragc-mutant mice show an inflammaging phenotype.
a, White blood cell (WBC) count performed in young (3–5-mo-old) and old (18-mo-old) Rragc+/+ (young, n = 8; old, n = 9) and RragcS74N/+ (young, n = 12; old, n = 12) males. Each colored stack represents cell-type percentage (Lym, lymphocyte; Neu, neutrophil; Mon, monocyte; Eos, eosinophil; Bas, basophil). Data are presented as mean ± s.d. b, Percentage of the indicated cell populations in the blood of 18-mo-old Rragc+/+ (n = 9) and RragcS74N/+ (n = 9) male mice. B, B cell; T, T cell; NK, natural killer; DC, dendritic cell; Mac, macrophage. c, Incidence of infiltrated inflammatory cells in the indicated tissues from 18-mo-old Rragc+/+ (n = 18) and RragcS74N/+ (n = 21) mice. d, Representative H&E pictures in the same mice as in c, showing inflammatory foci in kidney (dashed lines). e, Representative H&E pictures in the same mice as in c, showing inflammatory foci in pancreas (dashed lines). f, Quantification of inflammatory cytokines in sera from young (4-mo-old) and old (18-mo-old) Rragc+/+ (young, n = 4; old, n = 9) and RragcS74N/+ (young, n = 4; old, n = 9) male mice measured by Legendplex assay using flow cytometry. g, Graphical representation of the false discovery rates (FDRs) from the indicated KEGG, Hallmark, REACTOME and WikiPathways gene sets enriched in kidneys from 18-mo-old RragcS74N/+ (n = 5) versus Rragc+/+ (n = 5) mice. Statistical significance was calculated by two-way ANOVA (a,f); two-tailed Student’s t-test (b); and two-sided Fisher’s exact test (c).

