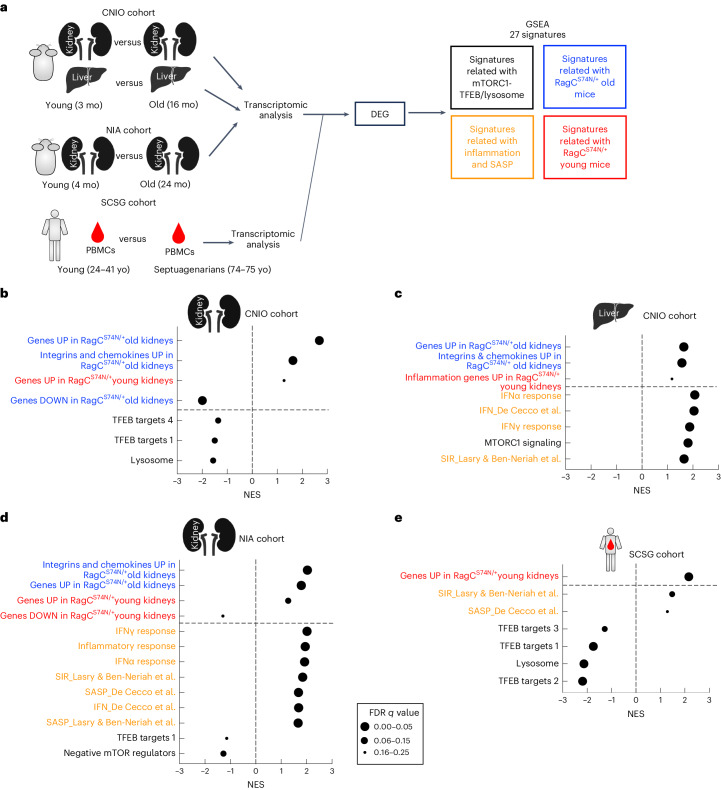
Fig. 3. Similarities between changes in Rragcmut/+ mice and physiological aging in mice and humans.
a, Experimental setup for the preranked GSEA performed in old and young wt mice from CNIO (kidney and liver) and NIA (kidney) cohorts, and the SCSG cohort (PBMCs from septuagenarians and young individuals) using 27 curated signatures related to mTORC1–TFEB and lysosomes (in black), signatures related to RragcS74N/+ old mice (blue), signatures related to inflammation and SASP (orange) and signatures related to RragcS74N/+ young mice (red). See Supplementary Table 2 for a detailed description of the signatures. b, Normalized enrichment score (NES) of indicated gene sets when comparing gene expression in old wt versus young wt kidneys from CNIO cohort. c, NES of indicated signatures when comparing gene expression in old wt versus young wt livers from CNIO cohort. d, NES of indicated signatures when comparing gene expression in old wt versus young wt kidney from NIA cohort. e, NES of indicated signatures when comparing gene expression in septuagenarians versus young PBMCs from the SCSG cohort. For b–e, a positive NES reflects enrichment of the gene set at the top of the ranked list and gene sets with a negative NES are overrepresented at the bottom of the gene list. The size of the bubble represents the FDR q value. Pictures of the liver and kidney were created with BioRender.

