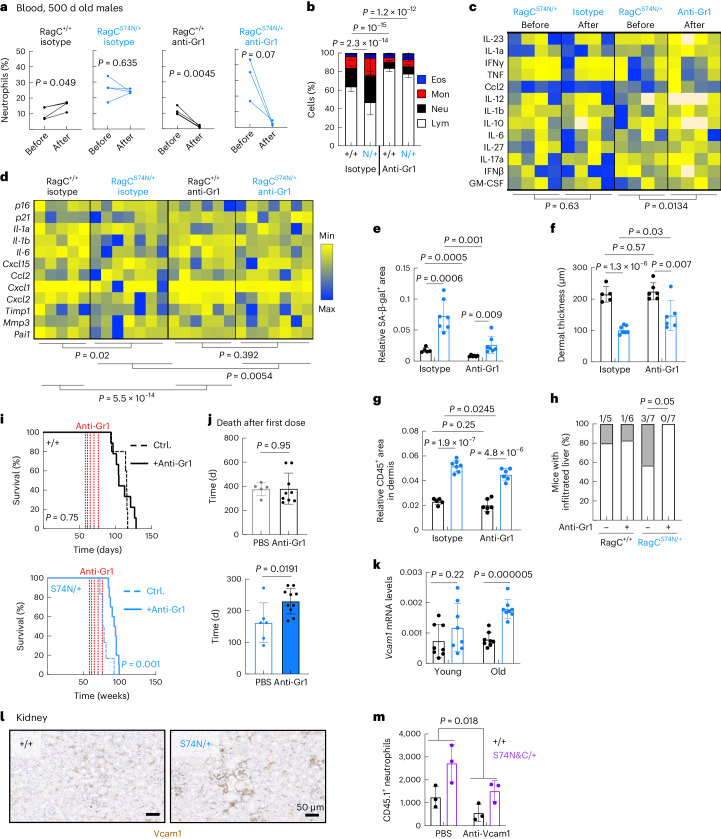
Fig. 7. Myeloid cell depletion corrects markers of inflammaging and extends survival in RragcS74N/+ mice.
a, Quantification of neutrophils in peripheral blood before and after a 5-day treatment with anti-Gr1 or isotype control antibody from isotype-treated Rragc+/+ (n = 4), anti-Gr1-treated Rragc+/+ (n = 4), isotype-treated RragcS74N/+ (n = 4) and anti-Gr1-treated RragcS74N/+ (n = 3) 24-mo-old male mice. b, WBC count in isotype-treated Rragc+/+ (n = 5) and RragcS74N/+ (n = 7), anti-Gr1-treated Rragc+/+ (n = 6) and RragcS74N/+ (n = 7) 24-mo-old male mice. c, Quantification of cytokines in sera from isotype-treated RragcS74N/+ (n = 4) and anti-Gr1-treated RragcS74N/+ (n = 4) 24-mo-old male mice in a 5-day treatment measured by Legendplex assay. d, qRT–PCR analysis of SASP genes in the kidneys from isotype-treated Rragc+/+ (n = 5) and RragcS74N/+ (n = 7), anti-Gr1-treated Rragc+/+ (n = 6) and RragcS74N/+ (n = 7) 18-mo-old male mice. e, Quantification of SA-β-gal+ area within the kidney area of isotype-treated Rragc+/+ (n = 5) and RragcS74N/+ (n = 7), anti-Gr1-treated Rragc+/+ (n = 6) and RragcS74N/+ (n = 7) of 18-mo-old mice. f, Dermal thickness in back skin of the same mice as in e. g, Quantification of IHC of CD45+ cells in skin from the same mice as in f. h, Incidence of infiltrated inflammatory cells in livers from mice in e. i, Kaplan–Meier survival curves of control (n = 5) and anti-Gr1-treated (n = 9) Rragc+/+ mice (left) and controls (n = 6) and anti-Gr1-treated (n = 10) RragcS74N/+ mice (right). j, Survival since the first dose of anti-Gr1 of the mice in k. k, qRT–PCR analysis of Vcam1 in kidneys of young (4-mo-old) and old (18-mo-old) Rragc+/+ (young, n = 8; old, n = 8) and RragcS74N/+ (young, n = 8; old, n = 8) male mice. l, Representative IHC staining of Vcam1 in kidney from 18-mo-old Rragc+/+ and RragcS74N/+ mice. m, Quantification of transferred wt CD45.1.1 neutrophils by IF in kidneys from CD45.2.2 host males treated with PBS (Rragc+/+ (n = 3); RragcS74mut/+ (n = 3)) or anti-Vcam1 (Rragc+/+ (n = 3); RragcS74mut/+ (n = 3)). Statistical significance was assessed by one-tailed Student’s t-test (a); two-tailed Student’s t-test (e–g, j,k); two-sided Fisher’s exact test (h); two-way ANOVA (b–d,m); and log-rank test (l). Data (b,e–g,j,k,m) are mean ± s.d.

