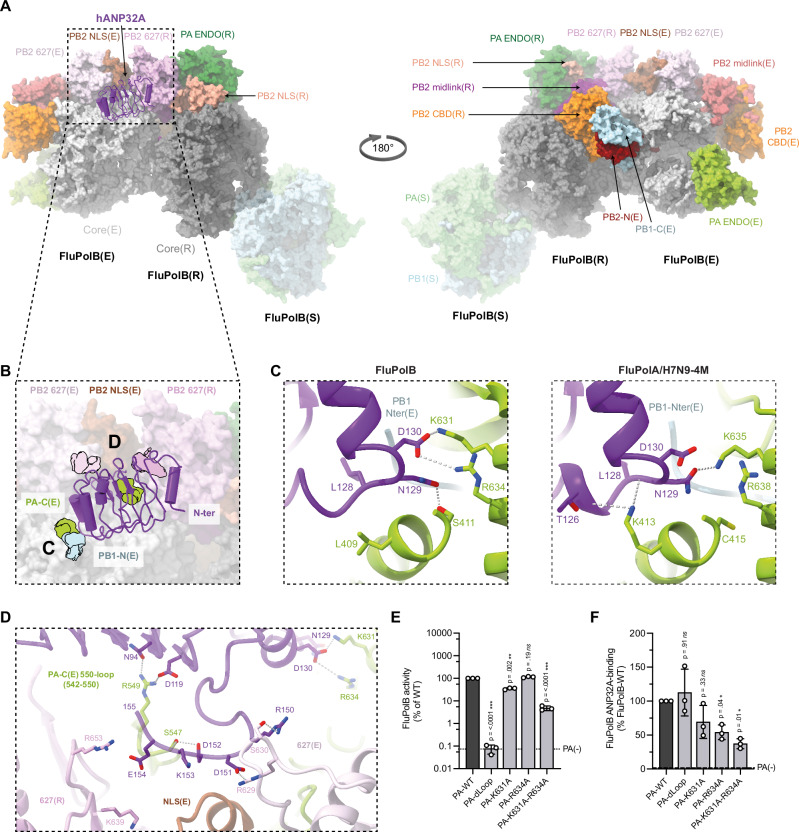
Fig. 5. Overall FluB trimeric replication complex and hANP32A interactions.
A Surface representation of the FluB trimer replication complex. hANP32A is displayed as cartoon, coloured in purple. FluPolB replicase (R) core is coloured in dark grey. PA ENDO(R) in dark green, PB2 midlink(R) in magenta, PB2 CBD(R) in orange, PB2 627(R) in pink, PB2 NLS(R) in beige. FluPolB encapsidase (E) core is coloured in light grey, PA ENDO(E) in light green, PB2 midlink(E) in salmon, PB2 CBD(E) in orange, PB2 627(E) in light pink, PB2 NLS(E) in brown. PB1-C(E) and PB2-N(E), respectively coloured in blue and dark red, interact with PB2 CBD(R) bridging FluPolB(R) and FluPolB(E). The symmetrical FluPolB(S) is coloured as in Fig. 4. B Close-up view on hANP32A interaction with FluPolB(R) and FluPolB(E). Interaction surface are highlighted, main contacts are labelled from (C) to (D), and coloured according to FluPolB interacting domains. PB1-N(E) is coloured in light blue, PA-C(E) is coloured in light green, PB2 627(E)/NLS(E), PB2 627(R) are coloured as in (A). C Comparison of the interaction between hANP32A 128-130 loop with FluPolB PA-C(E)/PB1-N(E) and FluPolA/H7N9-4M PA-C(E)/PB1-N(E). hANP32A and FluPol domains are coloured as in (B). Ionic and hydrogen bonding are shown as grey dotted lines. D Cartoon representation of the interaction between hANP32A curved β-sheet and LRR C-terminus with FluPolB PA-C(E) 550-loop, PB2 627(E)/NLS(E), PB2 627(R). hANP32A and FluPolB domains are coloured as in (B). Ionic and hydrogen bonding are shown as grey dotted lines. E Cell-based assay of B/Memphis/13/2003 FluPol activity for the indicated PA mutants. HEK-293T cells were co-transfected with plasmids encoding PB2, PB1, PA, NP with a model vRNA encoding the Firefly luciferase. Luminescence was normalised to a transfection control and is represented as a percentage of PA-WT (mean ± SD, n = 3, **p < 0.002, ***p < 0.001, one-way ANOVA; Dunnett’s multiple comparisons test). Source data are provided as a Source Data file. F Cell-based assay of B/Memphis/13/2003 FluPol binding to ANP32A for the indicated PA mutants. HEK-293T cells were co-transfected with plasmids encoding PB2, PA, PB1-luc1 and hANP32A-luc2. Luminescence signals due to luciferase reconstitution are represented as a percentage of PA-WT (mean ± SD, n = 3, *p < 0.033, one-way ANOVA; Dunnett’s multiple comparisons test). Source data are provided as a Source Data file.

