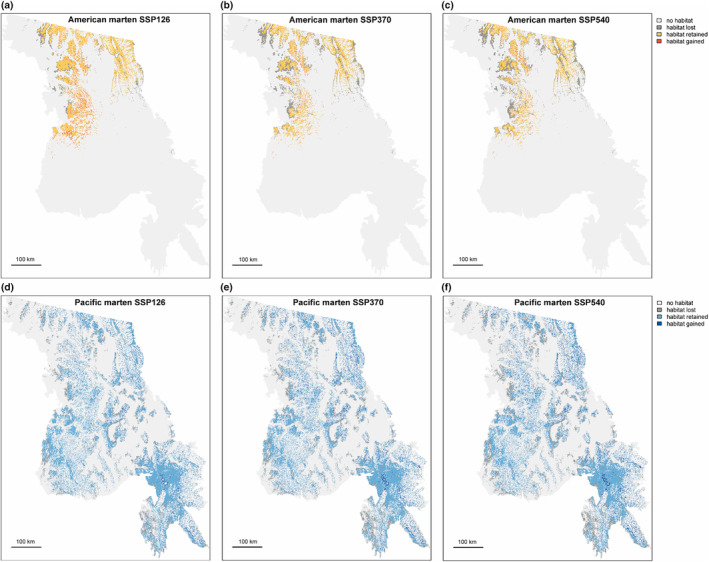
FIGURE 3.

Maps depicting predicted marten distribution for the period 2041–2070 by species (a–c: American marten, d, e: Pacific marten) under low, medium, and high emissions scenarios. Color coding represents habitat lost, retained, or gained relative to the present‐day species distribution. Maps showing continuous output are provided in Figure S5.
