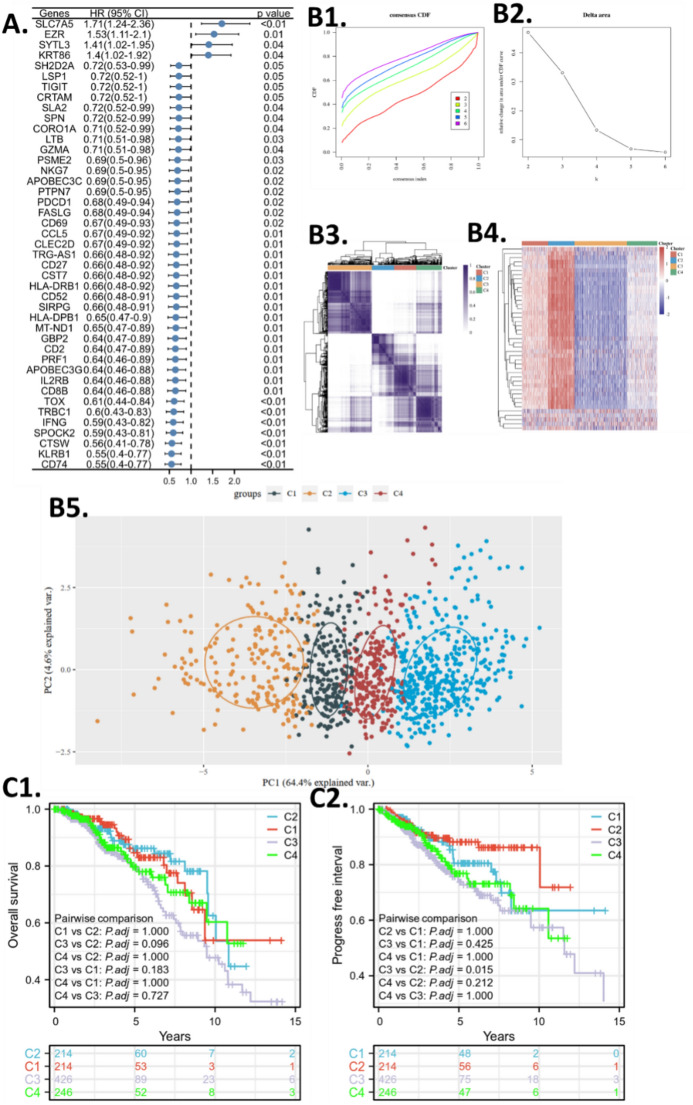
Figure 2.
CD8Tex-based subtype clustering. (A) Survival screening of the CD8Tex marker genes. The forest plot shows the hazard ratio (HR). (B1) Consensus Cumulative Distribution Function (CDF) plot of subtype numbers (k = 2–6). (B2) Delta area plot of the consensus CDF plot. (B3) Consensus matrix and cluster trees of subtypes. (B4) Gene expression heatmap of the subtypes. (B5) Principal Component Analysis (PCA) plot of the consensus clustering. (C1) Overall survival Kaplan–Meier plot (KM plot) of the subtypes. (C2) Progression-free interval KM plot of the subtypes.

