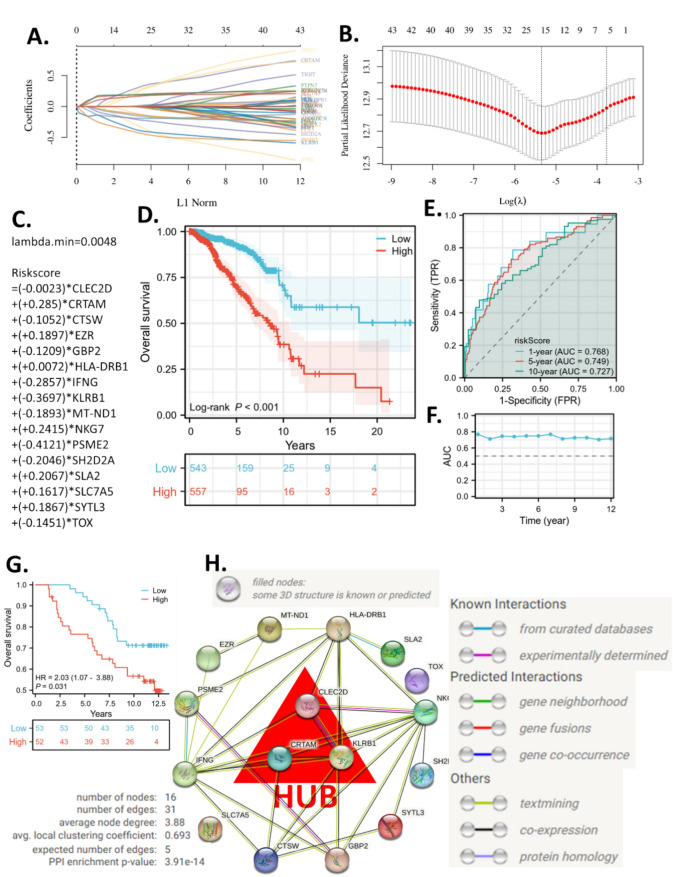
Figure 5.
Machine learning prognostic models based on CD8Tex marker genes and hub genes identification. (A-C) The λ and coefficients of the model. (D) Overall survival KM plots of high- and low-risk groups in TCGA-BRAC. (E) Representative time-dependent receiver operating characteristic (ROC) curve of the risk model. (F) Area Under Curve (AUC) of the time-dependent ROC curve of the risk model. (G) Overall survival KM plots of high- and low-risk groups in a validation cohort from Xena-hubs Breast Cancer (Caldas 2007). (H) The protein–protein interaction network with hub genes identified.

