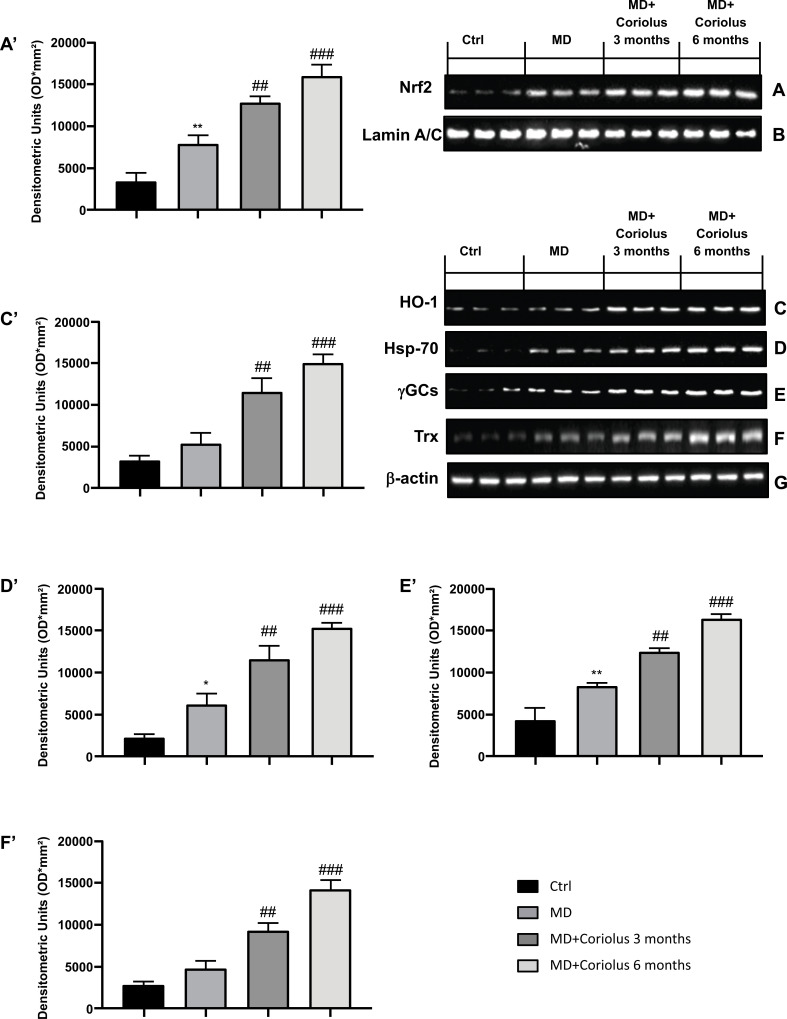
Fig. (3).
Modulation of Nrf2 pathway. Western blot analysis of Nrf2 expression (A) HO-1 (C), Hsp-70 (D), γGCs (E) and Trx (F). The expression of the protein bands was measured using densitometry (A’, C,’ D,’ E’ and F’) and standardized to β-actin (G) and Lamin A/C levels (B). *p<0.05 versus Ctrl; **p<0.01 versus Ctrl; ##p<0.05 versus MD; ###p<0.001 versus MD.

