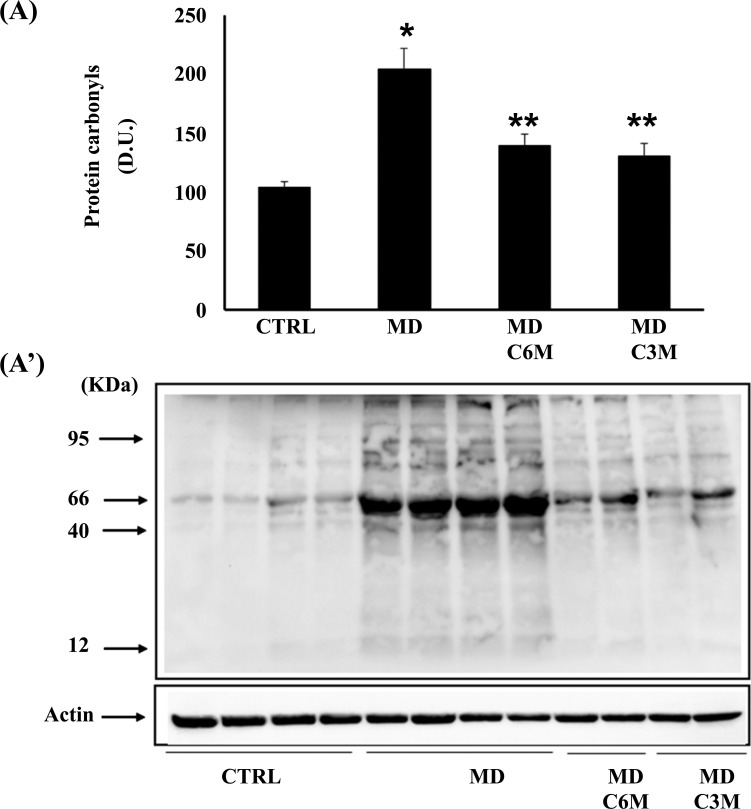
Fig. (5).
Effect of Coriolus on protein carbonyls in MD patients. (A) Densitometric evaluation: the bar graph shows the values are expressed as mean standard error of mean of 3 independent analyses. P < 0.05 vs control. (A’) A representative immunoblot is shown. β-actin has been used as loading control. D.U., densitometric units. *Significantly different from control (p < 0.05), **Significantly different from MD alone (p < 0.05).

