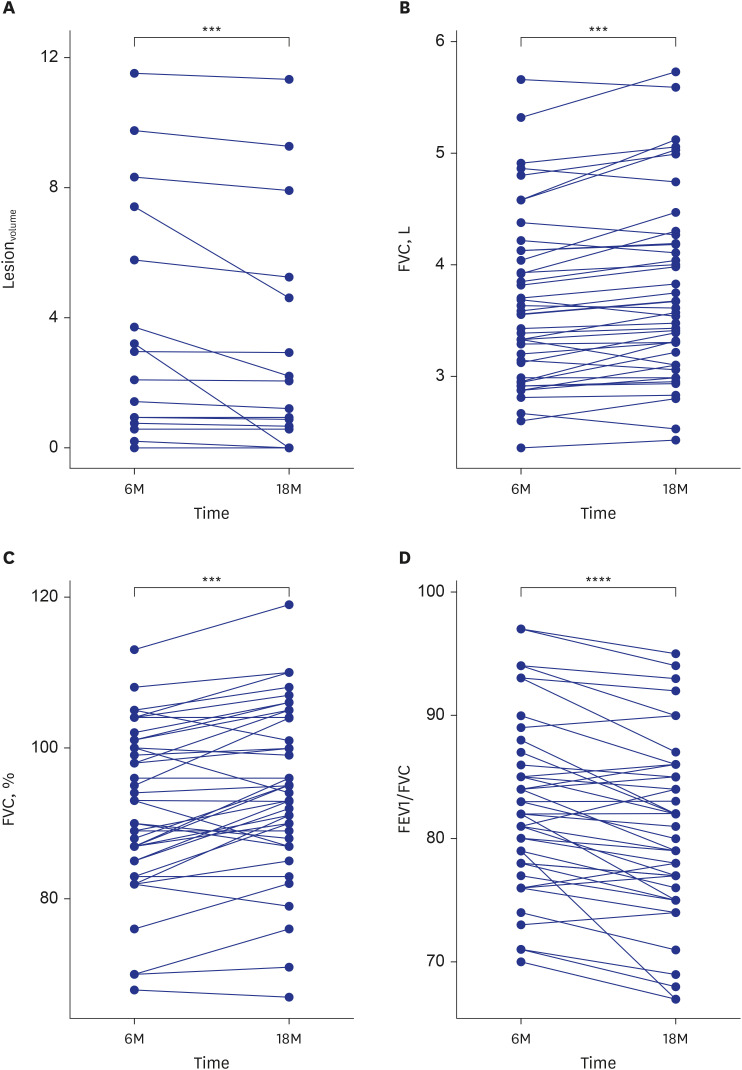
Fig. 1. Graphs comparing changes between 6 months (6M) and 18 months (18M), with specific changes in (A) lesionvolume, (B) FVC (L), (C) FVC (%), and (D) FEV1/FVC.
lesionvolume = lesion volume percentage, FVC = forced vital capacity, FEV1 = forced expiratory volume in 1 second.
Comparisons were performed with the paired t-test and Wilcoxon signed rank test.
***P < 0.001; ****P < 0.0001.

