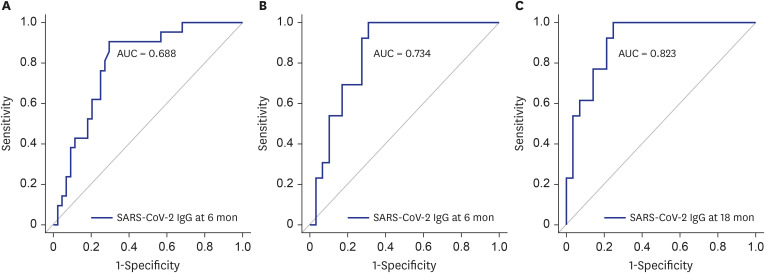
Fig. 2. The ROC curves of SARS-CoV-2 IgG levels for predicting CT abnormalities at 6 or 18 months. (A) ROC curves were used to test the performance of SARS-CoV-2 IgG level at 6 months for predicting residual CT abnormalities at 6 months, showing an AUC of 0.688 (95% CI, 0.798–0.908; P < 0.001). The cut-off IgG level at 6 months for predicting CT abnormalities at 6 months was 10.25 (sensitivity, 70.5%; specificity, 90.5%). (B) The ROC curve of IgG level at 6 months for predicting residual CT abnormalities at 18 months showed an AUC of 0.734 (95% CI, 0.849–0.964; P < 0.001). The cut-off value was 10.1 (sensitivity, 69.0%; specificity, 100%). (C) The ROC curve of IgG level at 18 months for predicting residual CT abnormalities at 18 months showed an AUC of 0.823 (95% CI, 0.823–0.909; P < 0.001). The cut-off value was 2.35 (sensitivity, 75.0%; specificity, 100%).
ROC = receiver operating characteristic, SARS-CoV-2 = severe acute respiratory syndrome coronavirus 2, IgG = immunoglobulin G, CT = computed tomography, AUC = area under the curve, CI = confidence interval.

