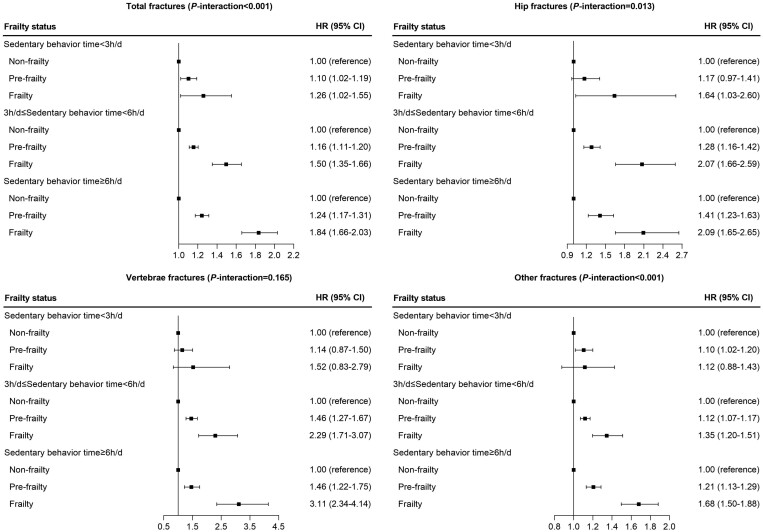
Figure 2.
Association of physical frailty status with risk of fractures stratified by sedentary behavior time via Model 3 adjusted for age (years), sex (male or female), ethnic background (White or others), Townsend deprivation index (continuous), household income (<£18 000, £18 000–£30 999, £31 000–£51 999, £52 000–£100 000, or >£100 000), body mass index (continuous), standing height (continuous), smoking status (never, previous or current smoking), alcohol intake (<1, 1–2, >2 times/week), healthy diet score (<3 or ≥3), sedentary behavior time (continuous), heel bone mineral density T-score (continuous), falls history (with or without), vitamin D supplementation (yes or no), calcium supplementation (yes or no), serum vitamin D (continuous), and serum calcium (continuous).

