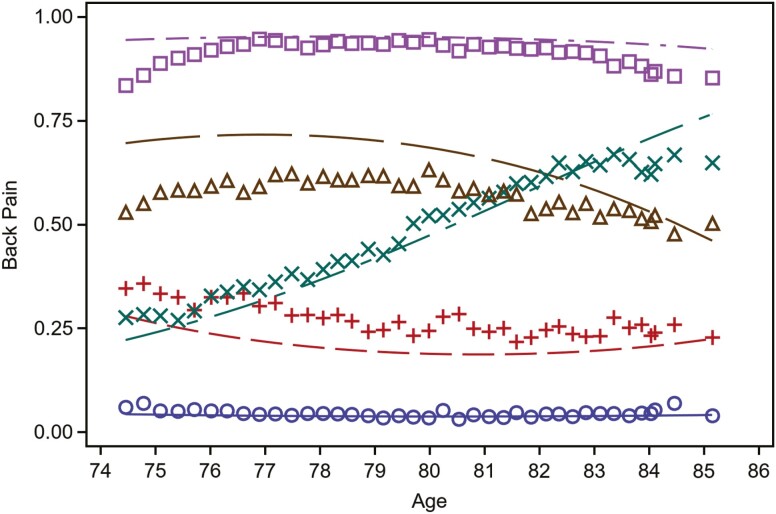
Figure 2.
LBP trajectories by age (5-class solution). Note: Class 1(○): no/rare LBP (N = 2 442/40.9%), 2(+): low frequency-stable LBP (N = 1 040/17.4%), 3(×): low frequency-increasing LBP (N = 719/12%), 4(Δ): moderate frequency-decreasing LBP (745/12.5%) and 5(□): high frequency-stable LBP (N = 1 030/17.2%). Interpretation of trajectory classes: Class 1 = low probability (<10%) of reporting LBP at each assessment; Class 2 = ~25% probability of reporting LBP at each assessment; Class 3 = increasing probability of reporting LBP at each assessment from ~25% to ~60%; Class 4 = between 50% and 75% probability of reporting LBP at each assessment; Class 5: high probability (>75%) of reporting LBP at each assessment.

