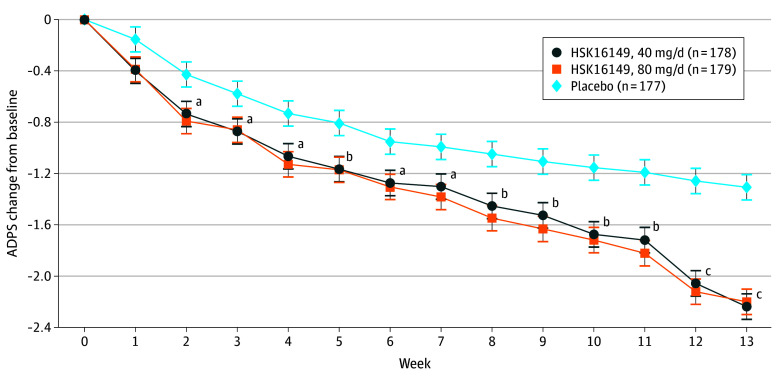
Figure 3. Average Daily Pain Score (ADPS) Change From Baseline, Weeks 1 to 13.
Baseline ADPS (<6 and ≥6) were used as covariables, and independent variables included treatment group, time, and interaction between time and treatment group. A repeated-measure mixed-effects model based on restricted maximum likelihood estimation was constructed to obtain the difference between groups and 95% CI (error bars).
aP < .05 compared with placebo.
bP < .01 compared with placebo.
cP < .001 compared with placebo.

