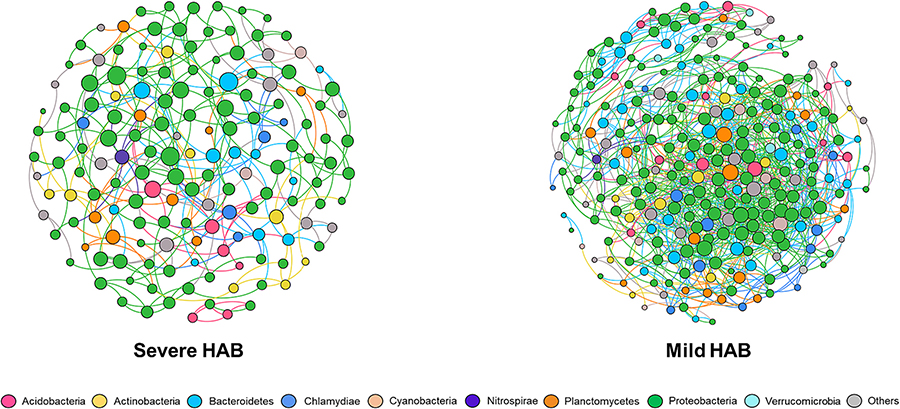
Fig. 4.
Networks of BAF bacterial communities during the severe (left) and the mild HABs (right). Each node represents taxa affiliated at phylum level (based on 16S rRNA), and edges between nodes represent a predicted interaction. The size of node is proportional to the number of connections (i.e. degree).

