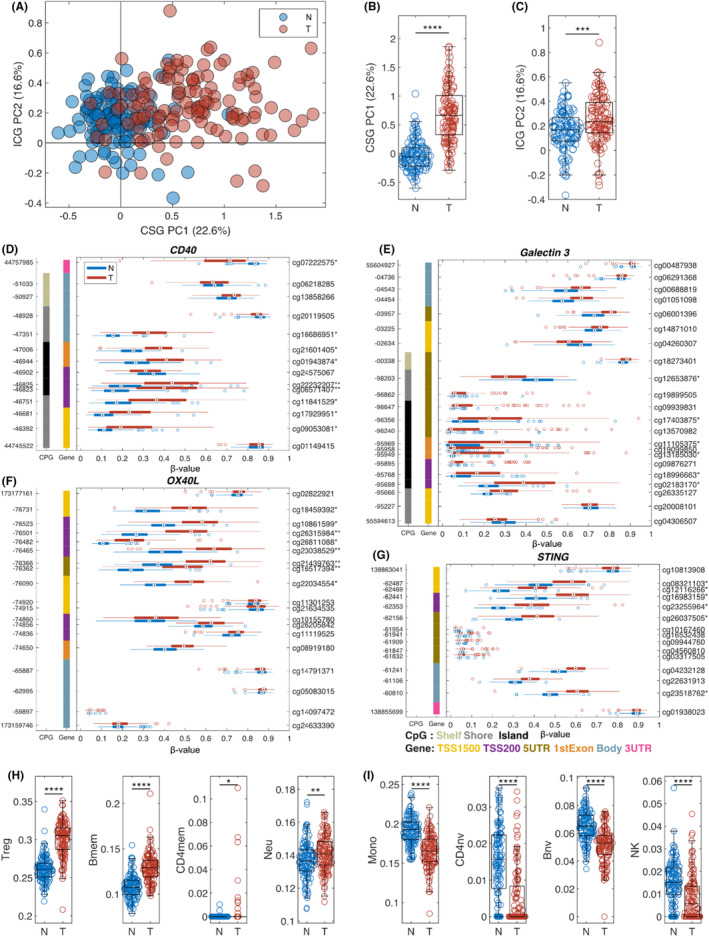
FIGURE 2.

Epigenetic changes in immune genes for AA PCa. (A) Scatter plot of prediction using immune synapse principal component analysis (PCA) model with adjacent normal tissue in blue and prostate cancer (PCa) in red. Boxplots of normal and tumor samples for co‐stimulatory genes (CSGs) (B) and immune checkpoint gene (ICG) (C). Several genes show a significant difference in methylation for the immune synapse genes (***p < 0.001, ****p < 0.0001). Individual gene structure methylation (GSM)‐plots for (D) CD40, (E) Galectin 3, (F) OX40L, and (G) STING (*q < 0.05 and |Δβ| > 0.1, **q < 0.01 and |Δβ| > 0.2). Boxplots comparing normal versus tumor for immune cell types with an increased amount in (H), and decreased amount in (I) in tumor compared to normal (**p < 0.01, ***p < 0.001, ****p < 0.0001).
