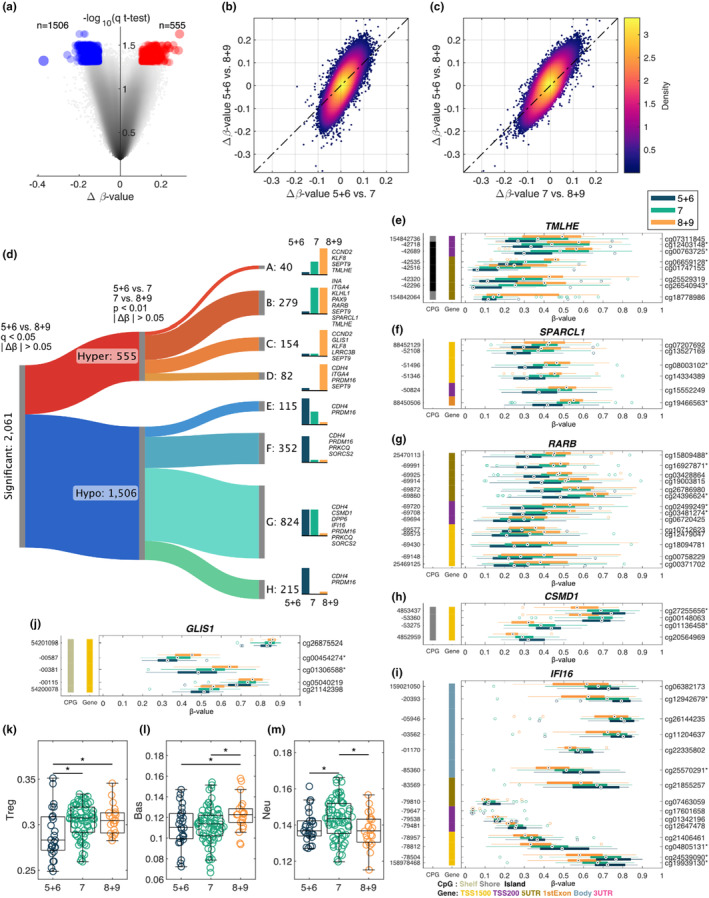
FIGURE 4.

Methylation changes based on Gleason score. (a) Volcano plot describing the methylation changes between samples with GG1 versus GG4/5, ∆β‐value on the x‐axis and multiple tested corrected p‐value on the y‐axis. Density scatter plot comparing the ∆β‐value for GG1 versus GG4/5 and (b) ∆β‐value for GG1 versus GG2/3 and (c) ∆β‐value for GG2/3 versus GG4/5. (d) Sankey diagram classifying significant (GG1 vs. GG4/5) CpG‐probes into eight different categories based on their changes when comparing GG1 versus GG2/3 and GG2/3 versus GG4/5. A, hypermethylated CpG‐probes that are significant in both GG1 versus GG2/3 and GG2/3 versus GG4/5. B, hypermethylated CpG‐probes that are significant in GG1 versus GG2/3. C, hypermethylated CpG‐probes that are significant in GG2/3 versus GG4/5. D, hypomethylated CpG‐probes that are not significant in any of the other comparisons. E, hypo‐methylated CpG‐probes that are significant in both GG1 versus GG2/3 and GG2/3 versus GG4/5. F, hypermethylated CpG‐probes that are significant in GG1 versus GG2/3. G, hypomethylated CpG‐probes that are significant in GG2/3 versus GG4/5. H, hypomethylated CpG‐probes that are not significant in any of the other comparisons. Selected genes are listed for each category. gene structure methylation (GSM) plots comparing the methylation levels between the three groups for (e) TMLHE, (f) SPARCL1, (g) RARB, (h) CSMD1, (i) IFI16, (j) GLIS1 (*q < 0.05 and |∆β| > 0.1 for GG1 vs. GG4 + 5). Boxplots comparing GG1 versus GG2/3 versus GG4/5 for immune cell types with (k) Treg, (l) Basophiles, and (m) Neutrophiles, *p < 0.05.
