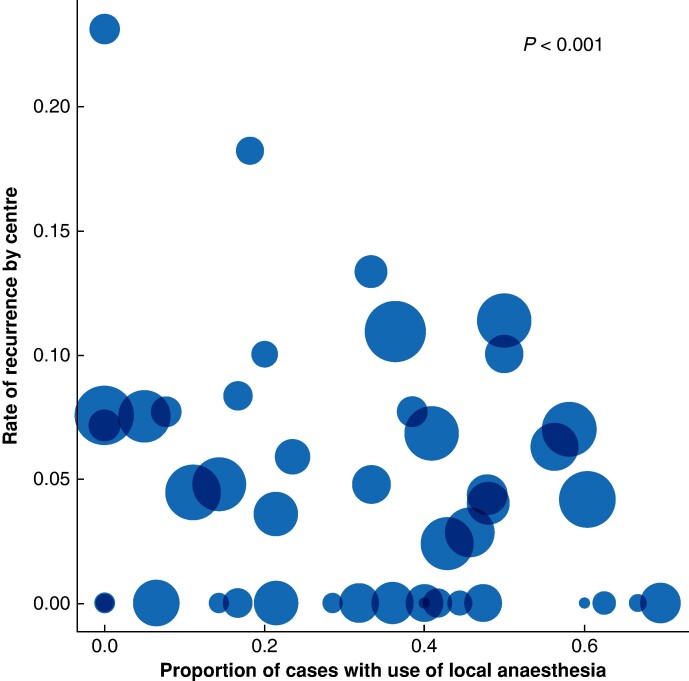
Fig. 2.
Variation in the use of local anaesthesia by centre
The graph depicts the variation in the use of local anaesthesia versus the rate of recurrence. Circle size is proportionate to the number of participants included by each centre. The P value, generated using a likelihood ratio test, confirms statistically significant variation in the use of local anaesthesia at the centre level (see the Methods section).

