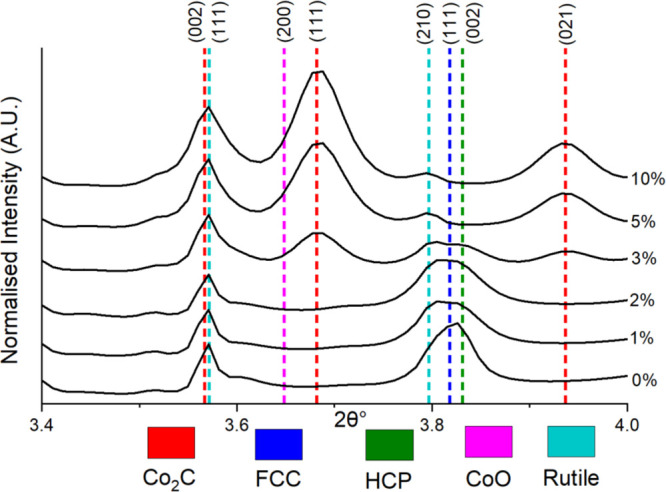
Figure 3.

Stacked mean XRD-CT patterns of all the different samples with varied Mn loading (labeled on right) showing the increasing Co2C content with increasing Mn loading and the concomitant loss of the Co metal phases (FCC and HCP). Low wt % of CoO was present in the higher Mn loading samples (5 and 10% Mn). Note that no reflections due to the anatase TiO2 polymorph are present in this portion of the diffraction pattern.
