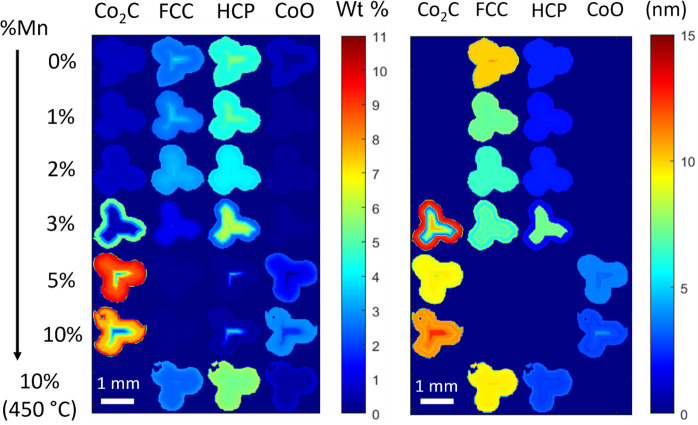
Figure 4.
Reconstructed XRD-CT 2D images of the catalytic pellets (extracted after 300 h) illustrating the refined wt % percentage (left) and crystallite size (right) of the different phases present. Increased Mn loading resulted in more cobalt carbide and a smaller particle size of the FCC phase. Lower Mn loadings had a higher presence of FCC and HCP phases. An egg-shell distribution is observed with Co2C egg-white and HCP in the center.

