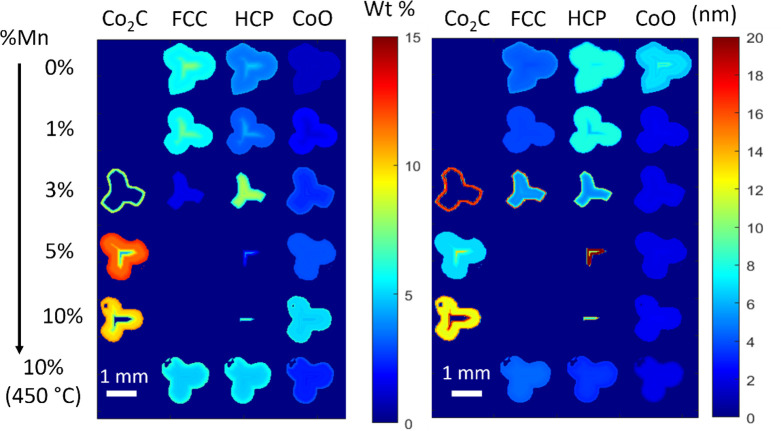
Figure 8.
Reconstructed PDF-CT 2D images of the catalytic pellets illustrating the refined wt % percentage (left) and crystallite size (right) of the different phases present in each pixel of the catalyst pellet for the different Mn loadings. Small CoO particles were present at higher Mn loadings while more HCP Co was present at the center of the 3% Mn sample.

