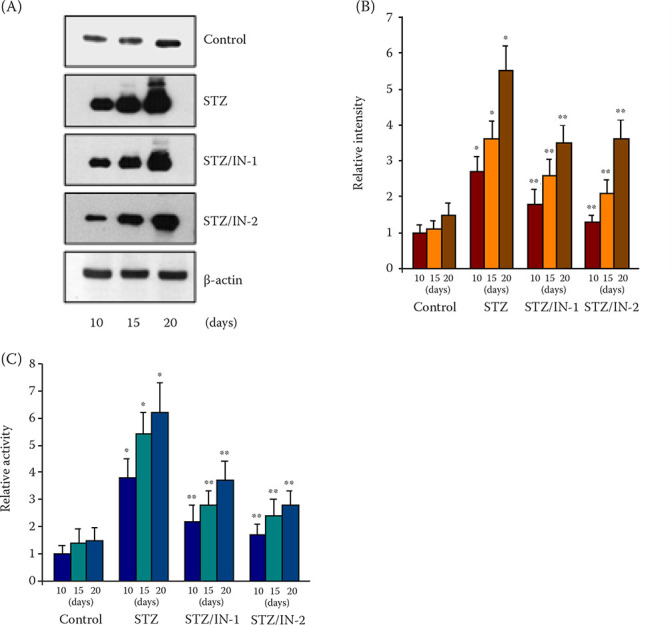
Figure 2. Immunoblots (A), their quantification (B), and catalytic activity (C) for CYP2E1.

In (B), the relative band intensities of CYP2E1 were determined using ImageJ software; the control sample at 10 days was set to one (1). In (C), the y-axis represents the relative activity of CYP2E1; the level of rat microsomes 10 days after injection of the citrate buffer was set to one (1). In (A), (B), and (C), five individual samples in each group were collected and used for the experiments
*P < 0.05, **P < 0.05 indicates a comparison with values of the normal and STZ-diabetic rats, respectively
Control, STZ, STZ/IN-1, and STZ/IN-2 represent the results for the immunoblot and catalytic activity with liver microsomes of the normal, STZ-diabetic, and STZ/albumin (IN-1 and IN-2)-treated rats, respectively
STZ = streptozotocin
