Figure 4.
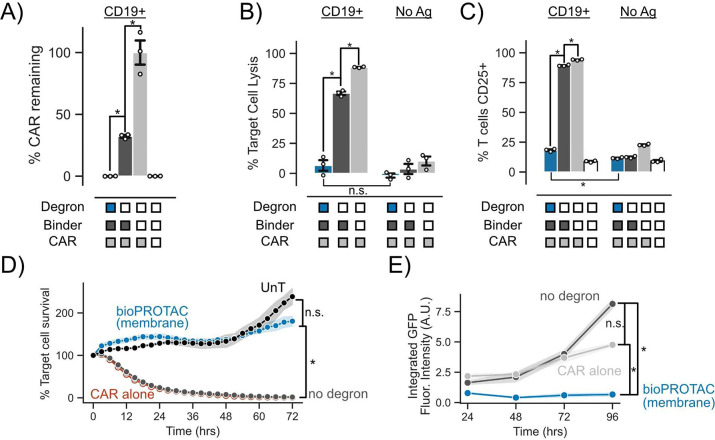
Membrane-tethered bioPROTAC abrogates CAR T cell signaling in primary human T cells. (A) bioPROTAC(membrane) coexpression reduced CAR expression in primary T cells. “% CAR remaining” is the background subtracted median CAR fluorescence normalized to the median fluorescence of background subtracted CAR only control. Dots represent technical replicates and error show SEM. Label above bars represent the antigen expressed on K562 target cells. (B) bioPROTAC(membrane) expression completely inhibited CAR cytotoxicity. Using flow cytometry, we measured CAR T cell cytotoxicity against CD19 expressing or no antigen K562s when cocultured at a 1:1 E:T ratio. Dots represent technical replicates, and error shows SEM. Labels above bars represent the antigen expressed on K562 target cells. (C) bioPROTAC(membrane) prevented upregulation of CD25. CD25 levels were measured by immunostaining followed by flow cytometry. Dots represent technical replicates, and error shows SEM. Labels above bars represent the antigen expressed on K562 target cells. (D) bioPROTAC(membrane) ablated CAR cytotoxicity even at high E:T ratios during a 72 h time course. Engineered T cell lines described above were challenged with Nalm6 cells at an E:T ratio of 3:1 and assayed for target cell clearance by live cell microscopy. Target cell survival was measured and analyzed using Incucyte software and hardware. Each dot represents the mean of three technical replicates and error shows SEM. (E) bioPROTAC(membrane) stifled CAR T cell proliferation and survival. In the same assay as described in panel D, we observed T cell population numbers by GFP fluorescence over 72 h by Incucyte image analysis. Each dot represents the mean of three technical replicates, and error shows SEM. An unpaired t test was used for all statistical comparisons. *P < 0.01; n.s. = not significant

