Fig 3.
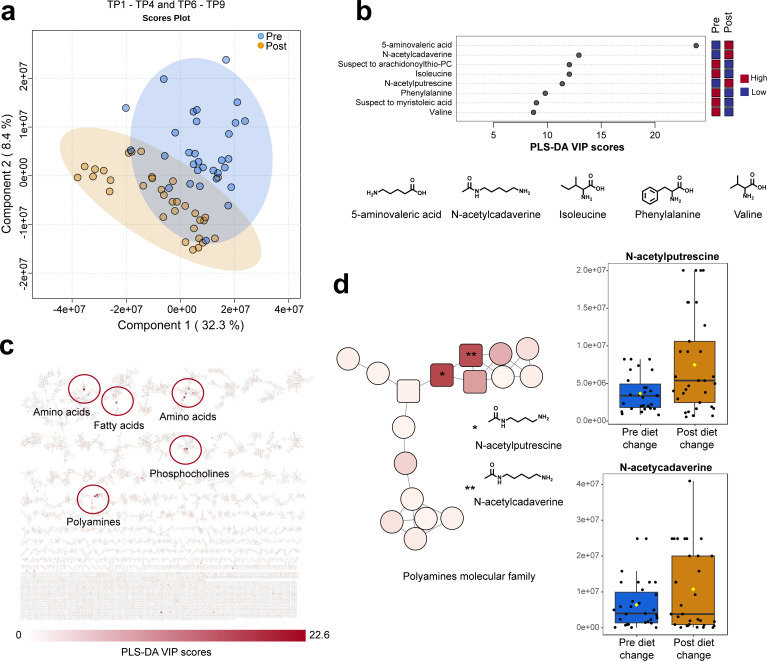
Impact of diet change on fecal metabolome. (a) PLS-DA analysis of fecal samples before (time points 1–4, Fig. 1A) and after (time points 6–9, Fig. 1A) diet change. (b) Top eight annotated molecules detected and identified using spectral libraries in GNPS. Chemical structures of representative identified molecules are shown. (c) Molecular networking highlighting molecular families, such as polyamines-related molecules, and color coded with the VIP scores from PLS-DA analysis. (d) Molecular family of polyamines, highlighting N-acetylputrescine and N-acetylcadaverine in pre- and post-diet change groups. Identification of molecules of interest was performed using spectral similarity to reference libraries in the GNPS platform.

