

Abstract
Wastewater from portable toilets (WWPT) is characterized by a high content of organic matter and a variety of chemical compounds that retain bad odors, especially phenols, a type of pollutant that is difficult to degrade by conventional treatments; in addition, it is persistent, toxic, and accumulates in the aquatic environment. Although different successful experiences with the use of Photo-Fenton are reported in the scientific domain, its application in WWPT is scarce and warrants study due to the wide use of portable toilets. The objective of this study was to evaluate the Photo-Fenton oxidation process in the removal of organic matter expressed as COD in a WWPT, as well as the reduction of phenols and BOD5. The experimental runs were carried out in a 0.50 L batch reactor to evaluate the effect of the factors (H2O2: 0.019, 25.56, 40.67, 87.24, 148.91, 174.45 g L−1 and pH: 2.80, 3.00, 3.27, 4.40, 5.53, 6.00 UNT) on COD removal and sludge production. It was found that the optimum operating conditions of pH 4.72 and H2O2 dosage of 174.45 g L−1 reduced the concentration of phenols by 97.83 % and 95.49 % of COD. In addition, 98.01 % of BOD5 was reduced, resulting in a biodegradability ratio (BOD5/COD) of 0.23 compared to the untreated wastewater of 0.53. From a cost perspective, the use of Photo-Fenton to treat wastewater under these conditions would be US$ 1.15 per liter.
Keywords: Wastewater, Portable toilet, Biodegradability, Photo-fenton, Phenols, Emerging pollutants, UV radiation
1. Introduction
It is estimated that 3.6 million portable sanitation units are used worldwide in scenarios where there are no fixed sanitation facilities [1]; in the specific case of Colombia, no information is available due to the lack of regulation of this activity. Each portable toilet has a different capacity according to its manufacturer, but they are designed to store significant amounts of wastewater, composed of drinking water, fecal matter and a variety of chemical compounds that inhibit the spread of bad odors, the latter being responsible for increasing the chemical oxygen demand (COD) of wastewater due to their low biodegradability [2,3]. The major chemical compounds present in portable toilet wastewater (WWPT) include phenols (C6H6O), anodic surfactant compounds such as sodium dodecyl benzene sulfonate (C18H29NaO3S), sodium alkyl benzene sulfonate (C11.6H24.2C6H4SO3Na) and dodecylbenzene sulfonic acid (C18H30O3S), ationic compounds such as benzalkonium chloride (C9H13CINR) and halogen isocyanurates such as sodium dichloroisocyanurate (C3N3O3Cl2Na) [2,4]. Despite the diversity of chemical compounds and organic matter (OM) present in WWPT, phenols are its main constituent [2].
Phenols are contaminants commonly found in industrial wastewater from the textile, pharmaceutical, agricultural, and plastics industries, among others [5,6]. These compounds are called refractory and belong to the contaminants of emerging concern (“CECs”), characterized by their toxicity, persistence and ability to accumulate in organisms and plants [7]. In addition, CECs are often combined with typical contaminants in municipal wastewater [8]. The negative impact of phenols and their derivatives lies in their resistance to degradation by conventional methods, such as the unit processes used in a municipal wastewater treatment plant (WWTP) [9,10]. The low efficiency of conventional systems to completely degrade contaminants such as phenols is since the processes are primarily designed to improve quality indicators such as dissolved organic carbon (DOC and BOD), suspended solids, and nutrients [11,12]. This results in the release of phenolic pollutants into the treated effluent, as is the case with WWPT.
Due to the limitations of conventional treatments, advanced oxidation processes (AOPs) have emerged as a potential solution to degrade recalcitrant and persistent contaminants of emerging concern in urban or industrial wastewater by highly reactive species [10,13]. AOPs can be chemical (H2O2/Fe2+ and O3/H2O2), photochemical (H2O2/UV, O3/UV, TiO2/UV, H2O2/Fe2+/UV), electrochemical and sonochemical, depending on their mechanism of action [14]. Photo-Fenton (PF) has the option of using the catalyst in the same medium as the substrate (homogeneous) or in a different medium from the substrate (heterogeneous) [15]. PF is a technology that involves the generation of short-living free radicals such as hydroperoxide ( con E0 = 1.48 V) and hydroxyl radical (∙OH con E0 = 2.8 V) for the rapid and non-selective oxidation of organic and inorganic pollutants present in wastewater, converting them to carbon dioxide and water or biodegradable products [16,17]. It reduces the toxicity of the effluent, improves the biodegradability and increases the efficiency of subsequent treatments [18].
On the other hand, PF combines the action of the Fenton process with ultraviolet (UV) light exposure to enhance iron regeneration and ∙OH production, increasing the efficiency of the process [19]. PF Consists of the decomposition of H2O2 in the presence of the reducing agent ferrous ion (Fe2+). In an acidic medium to produce ∙OH (Equations Equation 1, Equation 2)) and (Equations Equation 3, Equation 4)) with lower oxidative power, a reaction known as Fenton-Like [20,21]. The oxidation of Fe2+ to ferric ion (Fe3+) makes the reaction autocatalytic [22].
| Equation 1 |
| Equation 2 |
| Equation 3 |
| Equation 4 |
UV radiation causes charge transfer on Fe3+ complexes, leading to their dissociation into Fe2+ and ∙OH, in this way, so that the reduced iron Fe2+ exacts again with H2O2 to produce more ∙OH (Equation (5)), which can increase process efficiency and reduce sludge production [23,24]. Therefore, the Fe(OH)2+ is needed to regenerate iron and produce more ∙OH [10]. In turn, UV has a germicidal effect on pathogenic microorganisms, viruses and bacteria because it affects the structure of DNA, proteins and lipids [11], which inhibits cell replication [20,25].
| Equation 5 |
The performance of the PF process depends on the concentration of the Fenton reagents (Fe2+ and H2O2), he pH, the reaction time and the intensity of the UV radiation [26,27]. It also depends on the nature of the contaminants being degraded [[26], [27], [28]]. However, it is the Fenton reagents and pH that are the parameters affecting the degradation, with pH being the critical factor influencing the generation of ∙OH and the nature of the iron species [29]. It has been shown that an optimal pH range between 2.50 and 4.0 units (UNT) favors the formation of ∙OH and reduces the precipitation of iron and its species, with a specific value of 2.80 UNT considered the most appropriate [22,27].
Previous experience has reported removal rates of 95 % in 20 mg L−1 of phenols at pH 3.50 UNT, a dosage of 50 mmol L−1 of H2O2 and 0.20 g L−1 of cobalt ferrite by Ref. [30]. Likewise [31], indicate that they achieved 99 % of phenol removal in an olive mill wastewater with 2.00 mg L−1 of Fe3+ and 144 mg L−1 of H2O2 under circumneutral pH conditions. As well as other studies that achieved 88.20 % and 99 % reduction of phenol concentration under specific pH conditions and Fenton reagents [32,33]. On the other hand, 90 % of the COD in a real leachate wastewater was removed using an H2O2/COD ratio of 1.06 and a pH of 5.00 UNT [34]. Similarly, 93.20 % of the COD was removed from a textile effluent at a pH of 3.00 UNT, a concentration of Fe2+ and 300 mg L−1 of H2O2 [32], and 86 % of the COD was removed from the same type of effluent at a pH of 3.00 UNT, a dosage of 1 mM of Fe2+ and 11.70 mM of H2O2 [28].
Çiner and Gökkuş [35] conducted Fenton oxidation (FO) experiments to obtain maximum COD and color removal at pH, FeSO4 and H2O2doses and optimum oxidation time for Disperse Yellow 119 and Disperse Red 167 wastewater, showing COD removals above 97 %. However, the study was limited to a one variable at a time analysis (OVAT) which may not reflect the nonlinear relationships of the factors studied and affect the response variable. Also, Gökkuş et al. [36] determined the optimal operational conditions for initial pH, Fe2+, and H2O2 concentrations for the removal of Reactive Blue 19. They found that the Fenton oxidation process achieves 98.90 % color removal and 100 % COD removal. Despite these results, a regional optimization approach has not been developed. Although various successful applications of the Fenton process have been reported in the scientific literature, its implementation in WWTP is limited and warrants further study, especially considering that 3.6 million portable sanitation units are used globally in areas without fixed sanitation facilities. Furthermore, optimization approaches using response surface methodology to reduce phenol or COD concentrations in WWTPs under real conditions are also limited.
Therefore, in the present study, homogeneous PF was evaluated as a treatment method to remove organic matter (OM) in terms of COD, BOD5 and phenols in a WWPT generated in a developing country like Colombia, particularly in the city of Aguachica, Cesar. To achieve this objective, analyses of the physical and chemical parameters of the untreated and treated WWPT were carried out, and the interaction between H2O2 concentration and pH was analyzed to determine the optimal PF operating condition. For this purpose, the response surface optimization methodology is used to define regions where COD and phenol removal is promoted and the best operating conditions for the WWPT analyzed.
2. Materials and methods
2.1. Characterization of wastewater from portable toilets
The WWPT studied was supplied by a company in the municipality of Aguachica (Colombia), dedicated to the rental of mobile sanitation units and the collection of waste generated during events or constructions in the city. Once the water has been collected from the toilets, it is transported by truck to the municipal wastewater treatment plant for treatment and subsequent discharge into the stream known as “El Cristo”. It is known that each of the company's portable toilets has a maximum capacity of 300 L and can produce between 240 and 480 L of wastewater per week. However, the amount of wastewater is subject to uncontrollable variables such as: i) the number of personnel using the toilet and ii) the frequency with which they go to the toilet. It is important to note that the number of toilets varies depending on the activity performed at the site where they are located.
The sampling site was located at coordinates 8°18′18.56″N and 73°35′54.19.19″W (Fig. 1). A grab sample of 24.5 L was collected from mobile toilets through a gate valve connected to the WWTP transport vehicle, using a polyethylene container (Fig. 1-Supplementary). The sampling was conducted before the portable toilet company delivered the WWTP to the municipal treatment plant, so no pretreatment was applied. In-situ measurements of pH, electric conductivity, color, and turbidity parameters were made at the site. A 4.0 L sample was analyzed for BOD5, COD, and phenols, and in 1.5 L a sample of residual water was taken to measure the concentrations of sulfates, chlorides and total alkalinity. The same time the point sample was taken, it was transported to the laboratory of the Universidad Popular del Cesar-Aguachica section where it was filtered through a 15 cm diameter sieve to remove larger suspended solids. Finally, the sample was kept at a temperature below 10 °C. The selected parameters were used because they are required by the country's dumping regulations (Resolution 631 of 2015).
Fig. 1.

Map of Colombia. Zoom: Map of the department of Cesar, municipality of Aguachica, sampling site.
2.2. Setup and experimental design
Fig. 2 corresponds to the stages developed during the experiments carried out to identify the effect of Photo-Fenton on the removal of chemical oxygen demand and phenols present in portable toilet wastewater.
Fig. 2.

Diagram of the experimental stages of the research.
The experiments were carried out in a batch reactor (Fig. 3) with a treatment capacity of 0.50 L, equipped with a Puriplus lamp 22.50 cm long and 16 mm in diameter, with a UV-C radiation power of 6 Watts and a wavelength between 200 and 295 nm. In conjunction, a TECNAL model TE-0854 magnetic stirring plate was used to keep the wastewater in motion for 240 min. To adjust the pH of the raw WWPT to the established experimental conditions, 37 % hydrochloric acid (HCl) was used. In addition, to generate the ∙OH, isolved Fe2+ was used as a catalyst to decompose H2O2 30 % as an oxidant.
Fig. 3.
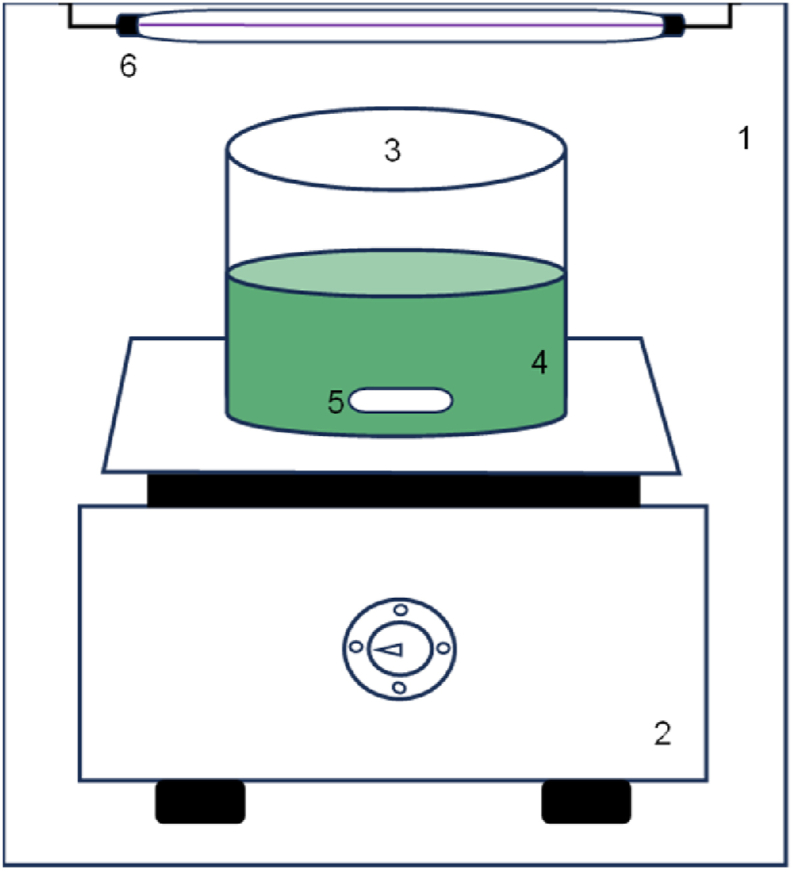
Schematic diagram of the photoreactor: 1) photoreactor frame 2) magnetic stirring plate 3) beaker 4) wastewater 5) magnetic stirring bar 6) ultraviolet lamp.
The 2K central composite design (CCD) was performed using Minitab® 21.4.2.0 software, considering H2O2 and pH as study factors. The factors and ranges evaluated were selected because they were the most reported for wastewater treatment. Each factor had six levels corresponding to 0.019, 25.56, 40.67, 87.24, 148.91, 174.45 g L−1 for H2O2 concentration and 2.80, 3.00, 3.27, 4.40, 5.53, 6.00 for pH. In total, there were nine treatments consisting of one central point with five replicates (R) and eight triplicate axial points with H2O2 dosages ranging from 0.019 to 174.45 g L−1 and pH values ranging from 2.80 to 6.00 UNT (Table 1). In addition, two other axial points were included, one without pH control or H2O2 dosage, where only Fe2+ was added, and the other where the wastewater was exposed to UV radiation only. As constant operating parameters of the process, a Fe2+ dosage of 1.79 g L−1 and a reactor with a capacity of 0.50 L of wastewater exposed to a UV-C radiation power of 6 Watts during a reaction time of 240 min were set. The reduction in COD concentration and sludge production in each experiment were set as response variables.
Table 1.
Experimental design.
| Treatment | Natural variables |
Coded variables |
||
|---|---|---|---|---|
| pH | H2O2 dosage (g L−1) | X1 | X2 | |
| T1 | 3.27 | 25.56 | 1 | 1 |
| T2 | 4.40 | 0.019 | −1 | 1 |
| T3 | 4.40 | 174.45 | −1 | 1 |
| T4 | 3.27 | 148.91 | 1 | 1 |
| T5 | 3.00 | 40.67 | 0 | 0 |
| T6 | 5.53 | 148.91 | 1 | 1 |
| T7 | 5.53 | 25.56 | 1 | 1 |
| T8 | 6.00 | 87.24 | −1 | 1 |
| T9 | 2.80 | 87.24 | −1 | 1 |
| T10 | No pH control | No dosage control | – | – |
| T11 | No pH control | No dosage control | – | – |
2.3. Analytical methods
The parameters were analyzed following the Standard Methods for examination of water and wastewater. Total Alkalinity, Chlorides and Sulfates were determined using the Methods/References: Potentiometer/2320 B, Argentometric/4500-C- B and Turbidimetric/4500-SO4−2 E, respectively. The pH was determined by Electrometric method/4500-H+ B (pHmeter: HI98191) in 38 samples of 0.50 L before and after PF. The Electrical Conductivity/2510 A of the same extracts was determined with an EC and TDS DiST® 4 HI98304 m. Turbidity was analyzed using the Nephelometric method/2130 B with an HI98703 Turbidity Meter and Color was measured by Spectrophotometric method/2120C with an HI83399 Multiparametric Spectrophotometer. COD was measured Spectrophotometrically/5220 B on 35 samples after PF treatment using an HI839800 Thermoreactor and an HI83399 Multiparametric Spectrophotometer. Sludge drying was performed after PF at a temperature of 105 °C in a WINCON W-20 oven. The parameters of the replicates of each treatment were averaged () and the standard deviation (S) was calculated. Phenols were determined in the final effluent treated with optimum pH and H2O2 dosage, using the Distillation method/5530 B, D; likewise, BOD5 and COD were calculated using the incubation method 5 days Optical Electrode/5210 B/4500-OH and Volumetric Closed Reflux/5220C. In addition, the maximum allowable limits according to Colombian regulations (Resolution 0631 of 2015) for parameters such as BOD5, COD and phenols were considered to verify the compliance with the parameters analyzed in the WWPT before and after PF treatment. Equation (6) was used to calculate the percentage removal of phenols, COD and BOD5.
| Equation 6 |
Where y are the initial and final concentrations of phenols (mg L−1), COD (mg O2 L−1) y BOD5 (mg O2 L−1) before and after PF treatment.
2.4. Optimization of experimental conditions
The experimental data were used to determine the optimal operating conditions by RSM using Minitab® 21.4.2.0 software. For this purpose, the COD (mg O2 L−1) and sludge production (g L−1) response variable data were fitted to an empirical statistical model with the general form presented in Equation (7). Additionally, the best response was found for electrical conductivity, color and turbidity; however, the effect of the independent variables on these parameters was not taken into account in the last tests, since the Colombian wastewater discharge regulations do not require them as control or quality parameters. The mathematical model was represented by a three-dimensional surface and contour plot developed in Matlab® to show the relationship between the studied factors and each response variable.
| Equation 7 |
Where Y corresponds to the response variable (COD and sludge), is a coefficient, and are linear coefficients, represents the interactive effect of the study factors and ;, k is the number of independent variables, and is the experimental error. For the response surfaces, a high coefficient of determination (R2 greater than 0.80) and a low root mean square error (RMSE) were considered as performance metrics to determine the robustness of the model and its predictive ability, respectively [37]. This allowed the theoretical definition of the best operating conditions, considering the Colombian regulations.
After using the RSM to determine the optimum operating condition, a new test was conducted with three replicates to validate the predicted results. Analysis of BOD5, COD and phenols was performed on a composite sample formed by the combination of the effluent from the three replicates, while pH, conductivity, color, turbidity and amount of sludge were measured on each sample and the results averaged.
2.5. Photo-fenton operating cost
The operating cost of the PF treatment was estimated in US$ per liter of treated wastewater, considering only the costs related to the acquisition of inputs and electricity according to the Colombian context. The prices used were: for hydrogen peroxide (US$ 3.86 per L H2O2 30 % v/v), iron sulfate heptahydrate (US$ 4.1 per kg Fe2SO4·7H2O), hydrochloric acid (US$ 79.04 per L HCL 37 % v/v) and electrical energy (US$ 0.07 per kWh). The costs were made to treat approximately 300 L, which corresponds to what the company that manages the portable toilets collects in a week. The cost methodology applied was carried out according to what was suggested by Trigueros et al. [38].
3. Results and discussion
3.1. Raw WWPT characteristics
Table 2 shows the physical and chemical characteristics of the untreated WWPT and the measured In-situ parameters. From the characterization the BOD5 was found in the range of 500–3000 mg O2 L−1, which classifies the water as highly polluted, and the COD was in the typical values for an industrial wastewater, between 2000 and 5000 mg O2 L−1 [39]. The discharge of this untreated wastewater into a receiving water body would result in the depletion of oxygen used by microorganisms to oxidize biodegradable organic matter, which in turn would affect the supply of oxygen necessary for the development of aquatic fauna and flora, leading to their disappearance and ultimately to the eutrophication of the receiving water body due to organic matter inputs [40].
Table 2.
Raw wastewater characteristics.
| Parameter | Result |
|---|---|
| BOD5 (mg O2 L−1) | 1957 |
| COD (mg O2 L−1) | 3660 |
| Total phenolic content (mg L−1) | 9.24 |
| Total alkalinity (mg CaCO3 L−1) | 1596 |
| Chlorides (mg Cl− L−1) | 716 |
| Sulfates mg SO42− L−1 | <10 |
| pH | 8.41 |
| Electrical conductivity (mS cm−1) | 10.48 |
| Color (PCU) | 4910 |
| Turbidity (NTU) | 195 |
The concentration of COD and BOD5 in untreated wastewater exceeded the limits established by Resolution 631 of 2015 for public sewerage service providers, with values for COD (150 mg O2 L−1) and BOD5 (90 mg O2 L−1). Similarly, for industrial, commercial or other service activities, with limits for COD of 50 mg O2 L−1, BOD5 of 50 mg O2 L−1 and phenols of 0.20 mg L−1. Total phenols also exceeded the concentration of 0.20 mg L−1 established for mining, hydrocarbon, manufacturing and production of goods and activities associated with services. This indicates that the untreated WWPT does not meet the requirements for discharge to surface water bodies or public sewers. If this were to occur, water quality would be adversely affected, particularly by chemical compounds such as phenols, which cause problems such as suffocation, gill necrosis, and slime production in aquatic animals such as fish, and interfere with the endocrine system, disrupting the oxidative phosphorylation reaction and ATP production [41]. Especially considering that phenols in wastewater in this study had a concentration of 9.2 mg L−1 and concentrations above 5 mg L−1 can damage cells [42].
The presence of inorganic anions such as chloride (Cl−) and sulfate ( ions could have an individual or combined effect on the degradation of the contaminants, thus affecting the efficiency of the PF process [43,44]. Especially because of the significant chloride concentration of 716 mg Cl− L−1. Chloride ions generate radicals ( less reactive than ∙OH and other radicals such as (Equations Equation 10, Equation 11, Equation 12, Equation 13), which complement the oxidation of the contaminant molecules [40,41]. However, these ions also react with Fe3+ to form Fe(Cl)2+ (Equation (8) and 9), a complex that affects the distribution and reactivity of iron ions, such as their concentration [43,44].
| Equation 8 |
| Equation 9 |
| Equation 10 |
| Equation 11 |
| Equation 12 |
| Equation 13 |
The same occurs with sulfate ions, which form a sulfate radical upon exposure to UV light (Equation (14)) [43,44]. The sulfate radical is an oxidizing species with a higher redox potential at neutral pH (2.5–3.1 V) compared to ∙OH (1.8–2.7 V), which contributes to the reaction mechanism of pollutant degradation [43,44]. In addition, the sulfate anion can react with a hydrogen and a ∙OH to form , which reacts with a water molecule and H2O2 to form ∙OH and (Equations Equation 15, Equation 16, Equation 17, Equation 18) [43,44]. Other chemical reactions also occur (Equations Equation 19, Equation 20, Equation 21, Equation 22) [43,44]. However, it is possible that because of the low sulfate concentration found (<10 mg SO4 L−1), few such radicals were generated, with a low contribution to the efficiency of the PF process.
| Equation 14 |
| Equation 15 |
| Equation 16 |
| Equation 17 |
| Equation 18 |
| Equation 19 |
| Equation 20 |
| Equation 21 |
| Equation 22 |
On the contrary, a significant number of chlorinated radicals and surfactants can reduce and eliminate ∙OH generated during PF reactions [43,44]. In addition, Cl− and ions cause the pH of the wastewater to decrease during PF [43,44]. It should be noted that no studies were found that analyzed the effect of alkalinity in the treatment of real or synthetic wastewater by PF, since this parameter usually has a greater impact on biological treatments. A high alkalinity was obtained with a value of 1596 mg of CaCO3 L−1, indicating a good capacity of the WWPT to neutralize acids, as well as the presence of basic substances characterized by ions such as OH−, and [45]. Although the biodegradability index (BOD5/COD) of 0.53 in the untreated WWPT indicates that biodegradation of organic matter is possible prior to physicochemical treatment [3], the presence of phenols highlights the need for their degradation by PF treatment. This is because the biological toxicity and chemical stability of phenolic substances inhibit the biodegradation, growth and reproduction of microorganisms [7]. In addition, a higher efficiency of AOPs compared to biological methods has been reported for the degradation of refractory contaminants [46].
3.2. WWPT characteristics treated with PF
A decrease in pH and an increase in conductivity of the effluent were observed, as shown in Table 3. These changes can be attributed to the fact that Fe2+ is an oxysalt, resulting in the release of salt ions and acids during its reaction. In addition, it is possible that both Fe2+ and Fe3+ reacted with chemical compounds present in the WWPT to form acids that contributed to the pH decrease. It was also possible that the pH was lowered by the effect of hydrogen ions (H+) formed during the PF process [9]. Although various chemicals are available to correct water acidity, sodium bicarbonate could be used to increase the pH of the WWPT. This substance tends to be a widely applied option to ensure buffer capacity in wastewater because of its cost, availability, and effectiveness.
Table 3.
WWPT characteristics after PF for the different treatments.
| Treatment | Parameter | ± S |
|---|---|---|
| T1 | pH | 2.43 ± 0.16 |
| Electrical conductivity (mS cm−1) | 18.17 ± 0.79 | |
| Color (PCU) | 18680 ± 178 | |
| Turbidity (NTU) | 6.14 ± 3.85 | |
| T2 | pH | 3.82 ± 0.48 |
| Electrical conductivity (mS cm−1) | 16.37 ± 1.02 | |
| Color (PCU) | 1398 ± 707 | |
| Turbidity (NTU) | 36.17 ± 28.4 | |
| T3 | pH | 2.79 ± 0.14 |
| Electrical conductivity (mS cm−1) | 15.17 ± 0.25 | |
| Color (PCU) | 11796 ± 8582 | |
| Turbidity (NTU) | 1.37 ± 0.87 | |
| T4 | pH | 2.08 ± 0.08 |
| Electrical conductivity (mS cm−1) | 18.42 ± 2.74 | |
| Color (PCU) | 6056 ± 7410 | |
| Turbidity (NTU) | 3.35 ± 0.62 | |
| T5 | pH | 2.24 ± 0.062 |
| Electrical conductivity (mS cm−1) | 16.30 ± 0.21 | |
| Color (PCU) | 15872 ± 3052 | |
| Turbidity (NTU) | 3.05 ± 1.63 | |
| T6 | pH | 2.65 ± 0.09 |
| Electrical conductivity (mS cm−1) | 14.70 ± 0.20 | |
| Color (PCU) | 4900 ± 127 | |
| Turbidity (NTU) | 1.37 ± 0.58 | |
| T7 | pH | 2.62 ± 0.03 |
| Electrical conductivity (mS cm−1) | 15.76 ± 0.47 | |
| Color (PCU) | 7190 ± 3346 | |
| Turbidity (NTU) | 4.31 ± 1.92 | |
| T8 | pH | 4.59 ± 0.86 |
| Electrical conductivity (mS cm−1) | 13.43 ± 0.21 | |
| Color (PCU) | 848 ± 661 | |
| Turbidity (NTU) | 21.63 ± 17 | |
| T9 | pH | 2.39 ± 0.02 |
| Electrical conductivity (mS cm−1) | 16.20 ± 0.08 | |
| Color (PCU) | 13490 ± 1260 | |
| Turbidity (NTU) | 3.77 ± 2.21 | |
| T10 | pH | 7.73 ± 0.15 |
| Electrical conductivity (mS cm−1) | 11.57 ± 0.38 | |
| Color (PCU) | 2663 ± 850 | |
| Turbidity (NTU) | 186 ± 61.9 | |
| T11 | pH | 8.25 ± 0.02 |
| Electrical conductivity (mS cm−1) | 9.54 ± 0.24 | |
| Color (PCU) | 3440 ± 108 | |
| Turbidity (NTU) | 28.10 ± 1.13 |
There was a minimum average increase in conductivity from 13.43 mS cm−1 to a maximum of 18.42 mS cm−1 at T8 and T4. The pH was the factor with the greatest influence on the conductivity result, with a p-value of less than 0.05. As shown in T4 and T6 with the same dosage of H2O2 of 148.91 g L−1 and pH of 3.37 and 5.53 UNT. The same behavior was shown in T8 and T9 using 87.24 g L−1 of H2O2 with pH of 6.00 and 2.80 UNT, and in T1 and T7. The best relationship between the factors studied and the final conductivity of the effluents treated with PF was found with a linear least squares model, as shown in Fig. 4.
Fig. 4.

Response Surface and Contour Plot for Conductivity (mS cm−1): Effect of pH and H2O2, at a Fe2+ concentration of 1.79 g L−1, a UV-C irradiance of 6 Watts and a reaction time of 240 min.
A color reduction of less than 4910 PCU was obtained with 0.019, 87.24, and 148.91 g L−1 H2O2 in the presence of 4.40, 6.00, and 5.53 UNT pH. While the color increased when the pH of the wastewater was conditioned below 4.40 UNT. There was a minimum color peak of 705 PCU and a maximum of 19920 PCU, as shown in Fig. 5, with pH being the most significant operating variable in the color changes, with a p-value of 0.001 in a linear plus interaction model. Colors ranging from green to various shades of yellow and orange were present in the PF-treated water (Fig. 2-Supplementary) after 1 h of treatment. This phenomenon was also reflected in the color of the settled sludge at the end of the process. These color changes indicate that the present pollutants were removed from the wastewater due to the decomposition of H2O2 by iron ions (Equations Equation 1, Equation 2)) [28].
Fig. 5.

Response Surface and Contour Plot for Color (PCU): Effect of pH and H2O2, at a Fe2+ concentration of 1.79 g L−1, a UV-C irradiance of 6 W and a reaction time of 240 min.
On the other hand, it is inferred that iron concentration has a strong effect on color removal and the orange color is attributed to the turbidity of iron ions in the effluent [19]. It was also observed that the effluent maintained a dark brown color after the addition of H2O2, which became lighter as the treatment time progressed (Fig. 3-Supplementary). It has been mentioned that this color is caused by the production of hydroquinone as an intermediate in the degradation of phenol, as well as the formation of carboxylic acids [9]. It is also important to note that the iron ions acted as coagulants by forming flocs among the sedimented pollutants, which allowed the reduction of suspended and dissolved solids, which in turn contributed significantly to the reduction of turbidity in the final effluent. The decrease in turbidity is also associated with the precipitation of ferric ions and ferric hydroxides formed in solution and degraded pollutants [47]. The turbidity of the treated water decreased with the increase in H2O2 concentration, which increased the availability of hydroxyl radicals to degrade the untreated WWPT particles and the intermediates formed. As observed when comparing T2 and T3 with a decrease of 81.54 % and 99.3 % at pH 4.40 UNT, T1 and T4 with 96.86 % and 98.28 % reduction at pH 3.27 UNT, and T6 and T7 with a turbidity reduction of 97.8 % and 99.29 % at pH 5.53 UNT. There was an increase in turbidity reduction at pH greater than 4.40 UNT. Turbidity removal had an optimal stable behavior with the experimental conditions used (Fig. 6), where H2O2 was the most influential factor with a p-value of 0.027.
Fig. 6.

Response Surface and Contour Plot for Turbidity (%): Effect of pH and H2O2, at a Fe2+ concentration of 1.79 g L−1, a UV-C irradiance of 6 W and a reaction time of 240 min.
3.3. Effect of pH and H2O2 dosage on COD removal
The variation of pH unit and H2O2 dosage showed a significant effect on the removal of COD from WWPT, achieving a reduction of this response variable in different percentages, as detailed in Table 4. A higher average removal efficiency of 82.10 % was obtained with a pH of 5.53 UNT and an H2O2 dosage of 148.91 g L−1, as well as an average removal of 81.34 % with a pH of 4.40 UNT and 174.45 g L−1 H2O2. On the other hand, by maintaining the previous pH values and reducing the dosage of H2O2, a decrease in COD removal efficiency was observed, specifically at a pH of 4.40 UNT and 0.019 g L−1 H2O2, with a minimum average removal of 41.33 %. Therefore, an increase in the dose of H2O2 improved COD removal. These results indicate a higher oxidation potential of ∙OH in this type of wastewater, above the optimum pH of 2.80 suggested in the literature [11,19,27]. However, the efficiency of PF in wastewater treatment at neutral pH without iron complexing agents has also been studied, showing good performance [48,49]. On the other hand, to avoid a decrease in PF efficiency due to iron precipitation under alkaline conditions, it has been recommended to use natural or chemical chelating agents that keep iron soluble and allow the Fenton reaction to take place at neutral or near-neutral pH [23,50,51]. Likewise, it has been mentioned that quinone derived from phenolic compounds from industrial wastewater can act as a chelating agent, allowing the Fenton reaction to take place at a high pH range [52].
Table 4.
COD removal (mg O2 L−1) in WWPT after PF.
| Treatment | Initial value | ± S | %RCODa |
|---|---|---|---|
| T1 | 3660 | 1208 ± 116 | 66.10 |
| T2 | 3660 | 2147 ± 47 | 41.33 |
| T3 | 3660 | 683 ± 159 | 81.34 |
| T4 | 3660 | 1014 ± 237 | 72.27 |
| T5 | 3660 | 823 ± 48 | 77.49 |
| T6 | 3660 | 655 ± 14 | 82.10 |
| T7 | 3660 | 784 ± 53 | 78.56 |
| T8 | 3660 | 883 ± 275 | 75.85 |
| T9 | 3660 | 725 ± 80 | 80.17 |
| T10 | 3660 | 1393 ± 678 | 61.93 |
| T11 | 3660 | 1252 ± 37 | 65.79 |
COD Removal Percentage.
It was found that the effect of pH and H2O2 dosage on COD removal followed a first order predictive model (Equation (23)). According to the regression analysis performed, the model explains the interaction between the independent variables and the response variable with a p-value of 0.024. The factor [H2O2] was the most significant factor in the reduction of COD within the 95 % confidence interval, with a p-value of 0.003. However, the interaction of pH and pH-[H2O2] had a low significance with a p-value greater than 0.05. The significant effect of H2O2 on COD removal is because this reagent is the main source to produce the ∙OH and also because it is an oxidant with a potential of 1.78 V [24,34].
| Equation 23 |
The %RCOD reached its maximum value, 84.75 %, when a pH of 4.40 UNT and 174.45 g L−1 of H2O2 were used. The optimum range to obtain COD removals higher than 80 % is at a pH higher than 4.40 UNT together with a dosage of H2O2 higher than 87.24 g L−1 (Fig. 7).
Fig. 7.

Response surface and contour plot for %RCOD: Effect of pH and H2O2, at a Fe2+ concentration of 1.79 g L−1, UV-C irradiance of 6 W and 240 min of reaction.
It was observed that the increase in H2O2 dosage did not negatively affect the treatment efficiency. Therefore, the maximum concentration of this reagent remained within the optimal range, as a concentration above its limit leads to the consumption of ∙OH and triggers secondary reactions. This results in the formation of with a lower oxidative capacity of the contaminants (Equations Equation 26, Equation 29)), which would result in a decrease in the efficiency of the process [10,26]. The same principle applies to the iron ion concentration (Equation (30)) [53], which remained stable. Therefore, an excess of the two reagents can induce low pollutant degradation efficiency, increase sludge formation, and raise COD in the effluent [28].
The efficiency of the process was enhanced by the absorption of UV radiation by H2O2 molecules at wavelengths shorter than 300 nm, which resulted in the production of ∙OH [54]. Additionally, the recovery of ferrous ions at wavelengths ranging from 250 to 400 nm contributed to the overall process [55]. The decomposition of hydrogen peroxide by ultraviolet radiation occurs in a series of phases. In the initial phase, the ionized form of hydrogen peroxide (HO2−) decomposes to produce a ∙OH and an anion radical (O∙), which generates another radical upon reaction with water (Equations Equation 24, Equation 25)). The second phase is the propagation phase (Equations Equation 26, Equation 27)), followed by the final phase involving the recombination of ∙OH (Equations Equation 28, Equation 29)) [18].
| Equation 24 |
| Equation 25 |
| Equation 26 |
| Equation 27 |
| Equation 28 |
| Equation 29 |
| Equation 30 |
The concentration of 1.79 g L−1 de Fe2+ in combination with UV radiation and in the absence of H2O2 at an average pH of 8.14 UNT was found to reduce COD by 61.93 % (T10); there was also a removal when only UV radiation was used. This is due to the coagulating power of the iron ions, and the direct chemical reaction of the UV radiation with the molecules present in the WWPT. The adsorption of UV energy by the molecules results in their breakdown into intermediates and total mineralization [24]. However, the type of pollutant and wavelength influence the process because pollutants absorb UV radiation differently and some are photostable [56]. In addition, when UV radiation reduces the size of molecules it is easier to degrade them by ∙OHs. UV photons also transmit energy to water molecules, breaking them apart and increasing the number of ∙OH available to react with contaminants, as presented in Equation (31) [22,24].
| Equation 31 |
On the other hand, the removal of COD was not affected by the presence of Cl− and in the WWPT. The reduction in COD is ultimately attributed to hydroxyl radicals and hydroperoxides formed during the Fenton reaction (Equations Equation 1, Equation 2)) [26]. The radicals decompose organic substrates (RH) by subtracting hydrogen, transferring electrons, and forming a double bond (C=C) with the organic molecules (Equations Equation 32, Equation 33, Equation 34) [21]. The reduction in COD is also attributed to the mineralization of phenols by hydroxyl radicals (∙OH), which initiates the first redox reaction. This process results in the formation of benzoquinone and hydroquinone. The oxidative opening of the six rings produces low molecular weight carboxylic acids, such as maleic, oxalic, and formic acids [9,17]. These acids may contribute to a decrease in pH, as evidenced in this study. Direct photolysis of the pollutants also improves the COD of the effluent. Furthermore, the hydroxyl radical (∙OH) formed by the photodecomposition of hydrogen peroxide (Equation (9)) and photosensitization of ferrous and ferric complexes (Equations Equation 5, Equation 35)) reduces the organic matter content, resulting in enhanced efficiency of the treatment system [24,26,27].
| Equation 32 |
| Equation 33 |
| Equation 34 |
| Equation 35 |
Although the effect of Fe2+ was not analyzed, the concentration used had a significant contribution in the production of ∙OH, which is a key factor in the reduction of COD as pointed out by Ref. [9].
3.4. Effect of pH and H2O2 dosage on sludge production
The combinations of pH and H2O2 evaluated in the experiments resulted in the precipitation of particles expressed as settleable solids and then as sludge, as detailed in Table 5. A minimum average sludge production of 2.09 g L−1 was observed when using pH 3.27 and 4.40 UNT together with H2O2 doses of 148.91 and 174.45 g L−1, respectively. In contrast, a higher sludge production of 2.86 g L−1 was recorded when using a pH of 6.00 UNT and H2O2 dosage of 87.24 g L−1. The deviation results indicate that there were no significant variations in sludge production when the Fe2+ dosage was kept constant, with minimal differences ranging from 0.03 g L−1 to 0.21 g L−1 compared to the mean.
Table 5.
Sludge production (g L−1) in WWPT after PF.
| Treatment | ± S |
|---|---|
| T1 | 2.26 ± 0.03 |
| T2 | 2.83 ± 0.20 |
| T3 | 2.09 ± 0.07 |
| T4 | 2.09 ± 0.06 |
| T5 | 2.66 ± 0.08 |
| T6 | 2.40 ± 0.10 |
| T7 | 2.60 ± 0.14 |
| T8 | 2.86 ± 0.06 |
| T9 | 2.29 ± 0.21 |
| T10 | 3.11 ± 0.04 |
| T11 | 2.69 ± 0.07 |
The formation of sludge in wastewater treatment with iron ions is directly related to the oxidation of Fe2+ to Fe3+ under pH conditions higher than 2.80 UNT, which deactivates the catalytic capacity of Fe3+ [27]. The above triggers a series of hydrolysis reactions and the formation of chemical complexes (Equations Equation 36, Equation 37, Equation 38, Equation 39), which are unable to participate in the Fenton reaction [52]. These reactions are dominated by ionic species such as Fe3+, Fe(OH)2+, Fe2(OH)24+, Fe(OH)2, Fe(OH)3, Fe(OH)4- and Fe(OH)63−, which favor the partial coagulation of macromolecules present in the wastewater [57]. In particular, ferrous (Fe(OH)2) and ferric (Fe(OH)3) hydroxides play a crucial role in the coagulation-flocculation process due to their higher charge density compared to the other iron(II) species [28,58]. Precipitated iron does not react with H2O2, nor is Equation (5) carried out, and Fe(OH)3 decomposes H2O2 into water and oxygen, reducing the amount of this reagent to produce ∙OH [28,51].
| Equation 36 |
| Equation 37 |
| Equation 38 |
| Equation 39 |
On the other hand, the absence of H2O2 produced the highest amount of sludge with a value of 3.11 g L−1, because no radicals are generated that can mineralize the particles present in the water, favoring their accumulation. On the contrary, an increase in the dose of H2O2 led to a decrease in the amount of sludge produced, as evidenced in T2 and T3 with a reduction of 74 %, where 0.019 and 174.45 g L−1 of H2O2 were used together with a pH of 4.40 UNT, an effect that was also registered between T1 and T4 with a 17 % reduction in the amount of sludge, with a pH of 3.27 UNT and doses of H2O2 of 25.56 and 148.91 g L−1.
The first order model (Equation (40)) describes the relationship between pH, H2O2 dosage and sludge production with a p-value of 0.003 for a linear plus interaction model. Excluding the effect of del Fe2+ on sludge formation, the model shows that pH is the most significant variable, with a p-value of 0.002 within the 95 % confidence interval. Meanwhile, H2O2 and the interaction pH-[H2O2] had low significance with a p-value greater than 0.05. The major influence of pH on sludge production is due to the reciprocal relationship between the oxidation potential of ∙OH and pH, as pH controls the chemical stability of H2O2 [28].
| Equation 40 |
Sludge production achieved its minimum value of 0.42 g L−1 at a pH of 3.00 UNT and 40.67 g L−1 H2O2. The optimum range to obtain a sludge production lower than 0.70 g L−1 occurs at a pH higher than 3.00 UNT and an H2O2 dosage higher than 25.56 g L−1 (Fig. 8).
Fig. 8.

Response and contour surface for sludge formation: effect of pH and H2O2, at Fe2+ concentration of 1.79 g L−1, UV-C irradiation power of 6 W, and 240 min reaction time.
When using a pH higher than 3.00 UNT, it is likely that species such as , and were formed, favoring the precipitation of iron [20]. As well as the precipitation of Fe(OH)3 at pH higher than 3.05–4.00 UNT [28,55]. The above decreases the availability of Fe2+ catalyst, the regenerative cycle of Fe3+ to Fe2+ and increases the formation of sludge [19,28], as observed in the results obtained.
However, sludge formation also occurred at pH lower than 3.00 UNT, specifically at 2.80 UNT, which was not suggested by some studies [22,27]. Nevertheless, it could not be confirmed whether the precipitation of iron species, especially Fe(OH)3, increases the amount of sludge, decreases the degradation of pollutants and reduces the efficiency of the process at pH higher than 6.00 UNT, as stated in the literature [28,58]. However, it was found that the amount of sludge was higher when combining a low dose of H2O2 with a pH higher than 4.40 UNT, due to the fact that the precipitation of iron species was favored in this medium, which reduced the regeneration of Fe2+, resulting in a lower production of ∙OH radicals and a reduced efficiency in the removal of COD, as detailed in Table 5.
Since the sludge characteristics were not determined, analyzing the physical, chemical, and biological properties of sludge from WWTP treated with the PF is necessary. This includes macro and micronutrients, pathogens, and organic and inorganic contaminants. Sludge composition varies with wastewater pollution load and treatment processes. Based on this analysis, it can be decided if the sludge can be used for agricultural or forestry purposes or must be disposed of in sanitary landfills.
3.5. Optimization of pH and H2O2 dosage and validation of the predictive model
It was found that using a pH of 4.72 UNT and 174.45 g L−1 of H2O2, i.e., a molar ratio of 0.032 Fe2+/5.13H2O2 a COD removal of 84.75 % could be achieved with a desirability (d) of 1.0 and a minimum sludge production of 0.73 g L−1 with a (d) of 0.57 as shown in Fig. 9.
Fig. 9.

Interaction plots between independent variables (pH and H2O2) and output responses.
After the validation of the composite optimization, an average sludge production of 0.73 g L−1 was obtained, which met the minimum requirement estimated by the model. In addition, a 95.49 % removal of COD was obtained, reducing it to 165 mg O2 L−1 compared to the initial 3660 mg O2 L−1, therefore the validation for this parameter exceeded the predicted %RCOD of 84.75 %, confirming the validity of the predictive model and the effectiveness of the optimal treatment condition. The characteristics of the effluent treated at the optimum conditions are presented in Table 6.
Table 6.
Characteristics of treated WWPT using the optimal pH and H2O2 dosage.
| Parameter | Value |
|---|---|
| BOD5 (mg O2 L−1) | 38.90 |
| COD (mg O2 L−1) | 165 |
| Total phenolic content (mg L−1) | <0.20 |
| pH | 2.20 |
| Electrical conductivity (mS cm−1) | 13.30 |
| Color (PCU) | 4859 |
| Turbidity (NTU) | 5.48 |
| Sludge (g L−1) | 0.73 |
Under the same optimum operating conditions, a 97.83 % reduction in phenol concentration was achieved, from 9.24 mg L−1 to less than 0.20 mg L−1. Similarly, a 98.01 % removal of BOD5 was achieved, from 1957 mg O2 L−1 to 38.90 mg O2 L−1. This resulted in a reduction of the biodegradability index of 0.23 compared to the untreated WWPT, which had a value of 0.53. The biodegradability behavior is theoretically attributed to the residual presence of H2O2 in the PF-treated water at the time of COD and BOD5 analysis, which masked the actual behavior of these two parameters [59]. This occurs because H2O2 consumes potassium dichromate, which increases the COD value (Equation (41)) [60]. Furthermore, in his research, Gilpavas [28] increased the BOD5/COD ratio from 0.13 to 0.54 after eliminating the H2O2 residue in the treated effluent.
| Equation 41 |
The composite optimization allowed to comply with the BOD5 limit concentration (90 mg O2 L−1) for public sewerage service providers and the standards established for industrial, commercial, or service activities other than those contemplated in Chapters V and VI with BOD5 limits (50 mg O2 L−1) and phenols of 0.20 mg L−1. Also, the phenol concentration limit of 0.20 mg L−1 was met for mining, hydrocarbon, manufacturing and production of goods and service activities. On the other hand, the effluent did not meet the limits of 150 mg O2 L−1 and 50 mg O2 L−1 for COD. The results obtained in this study demonstrate the effectiveness of PF in the reduction of COD, elimination of phenols and significant removal of BOD5 from WWPT. However, a typical characteristic of homogeneous PF, sludge formation, caused by coagulation of pollutant molecules and precipitation of iron ions and their species, was present [15].
On the other hand, it was identified that the cost of wastewater treatment under optimization conditions corresponds to US$ 1.15 per liter. Although this value is lower than that reported by Poblete et al. [61] who found costs close to US$ 24 in the treatment of vinasse waters which are characterized by their high phenol content. It is necessary to carry out a much more detailed economic analysis considering operational aspects and maintenance on a larger scale. In addition, the environmental taxes that are governed in Colombia for the discharge of wastewater must be considered.
4. Conclusions
Under the established experimental conditions, the average COD removal varied from a minimum of 41.33 % to a maximum of 82.10 % in the different treatments. Similarly, sludge production ranged from 2.09 g L−1 to 3.11 g L−1. Under optimum conditions, with a pH of 4.72 UNT and a molar ratio of 0.032 Fe2+/5.13H2O2, a maximum COD removal of 95.49 %, a phenol reduction of 97.83 % and an average sludge production of 0.73 g L−1 were achieved. These results demonstrate the efficiency of the PF in both removing organic matter and reducing the presence of phenols in the WWPT.
It was found that the dose of H2O2 was the most influential factor in the reduction of COD, with better results obtained as its concentration increased. While pH had a greater effect on sludge production when Fe2+ concentration was kept constant, sludge production increased with a low dose of H2O2 in the company of a pH higher than 4.40 UNT. It was clear that by keeping the treatment time, Fe2+ dosage and UV intensity constant, the amount of hydroxyl radicals depended directly on the variation of the H2O2 dosage; therefore, by increasing the amount of oxidant, the generation of radicals involved in the decomposition of the molecules also increased. On the other hand, the presence of chlorine and sulfate anions in the WWPT did not harm the removal of COD, phenols and BOD5 when using the PF. The residual fraction of organic matter in the WWPT treated under optimal conditions highlights the need to consider PF treatment in combination with a conventional unit operation or other AOP to obtain an effluent that complies with the COD limit concentration established in the Colombian regulatory framework.
Finally, this study shows the importance of treating wastewater from portable toilets, which are treated as if they were domestic wastewater, however, they present emerging contaminants such as phenols that conventional treatments are not able to eliminate. Therefore, the application of Photo-Fenton in this type of water establishes an opportunity to continue analyzing this process, little explored in real wastewater. It is also necessary to investigate the process using indicators of sensitive organic matter such as TOC and analyze the possible excess of iron ions in the effluent or sludge. Furthermore, in the future it is necessary to evaluate the effect of increased exposure to UV radiation on the degradation of emerging contaminants such as phenols and sludge production.
Data availability statement
All data generated or analyzed during this study are included within the article.
CRediT authorship contribution statement
Yorgi San Juan-Garisado: Writing – original draft, Software, Methodology, Formal analysis, Data curation. Francisco Luna-Guevara: Writing – review & editing, Conceptualization. Pablo Alberto Herrera: Writing – original draft, Software, Methodology, Formal analysis, Data curation. Jonathan Soto-Paz: Writing – review & editing, Investigation. Jesus David Alvarez-Trujillo: Writing – review & editing, Investigation. Cristian Mejia-Parada: Writing – review & editing. Brayan Alexis Parra-Orobio: Writing – review & editing, Supervision, Methodology, Investigation, Funding acquisition, Conceptualization.
Declaration of competing interest
The authors declare the following financial interests/personal relationships which may be considered as potential competing interests:
Francisco Luna-Guevara reports was provided by Universidad de Santander. If there are other authors, they declare that they have no known competing financial interests or personal relationships that could have appeared to influence the work reported in this paper.
Acknowledgments
The authors thank the Universidad Popular del Cesar seccional Aguachica for funding the research group “Valorización y Aprovechamiento de Biomasa Residual por Bioprocesos Ambientales”. Also to the Universidad de Investigación y Desarrollo for the time given to Dr. Jonathan Soto Paz. In addition, the authors would like to thank the Company of Portable Toilets of the Municipality of Aguachica for providing wastewater for the experiments developed in this research.
Footnotes
Supplementary data to this article can be found online at https://doi.org/10.1016/j.heliyon.2024.e35286.
Contributor Information
Yorgi San juan-Garisado, Email: yfsanjuan@unicesar.edu.co.
Francisco Luna-Guevara, Email: fra.luna@mail.udes.edu.co.
Pablo Alberto Herrera, Email: pabloherrera@unicesar.edu.co.
Jonathan Soto-Paz, Email: jsoto3@udi.edu.co.
Jesus David Alvarez-Trujillo, Email: jesus2228075@correo.uis.edu.co.
Cristian Mejia-Parada, Email: cmejia5@udi.edu.co.
Brayan Alexis Parra-Orobio, Email: baparra@unicesar.edu.co.
Appendix A. Supplementary data
The following is the Supplementary data to this article:
References
- 1.Portable Sanitation Association International . United States; 2024. About Portable Sanitation [Internet]https://www.psai.org/ Available from: [Google Scholar]
- 2.Supo-Quispe L. Degradación del fenol en aguas residuales de baños químicos portátiles del sector construcción mediante Pseudomonas aeruginosa [Tesis doctoral]. Puno. Perú: Universidad Nacional del Altiplano de Puno. 2021;10(1):1–97. http://repositorio.unap.edu.pe/bitstream/handle/20.500.14082/13838/Luis_Alberto_Supo_Quispe.pdf?sequence=1&isAllowed=y [Google Scholar]
- 3.Yun-Young C., Seung-Ryong B., Jae-In K., Jeong-Woo C., Hur J., Tae-U L., et al. Characteristics and biodegradability of wastewater organic matter in municipal wastewater treatment plants collecting domestic wastewater and industrial discharge. Water (Basel). 2017;9(6):409. doi: 10.3390/w9060409. [DOI] [Google Scholar]
- 4.Perry R.H. Tomo V. México. Editorial Mac Graw Hill; 1994. Manual del Ingeniero Químico. 6ta edición (3r edición en español)https://www.academia.edu/51039907/Manual_del_Ingeniero_Qu%C3%ADmico_Tomo_VI_Perry [Consultado el 22 de febrero de 2024] [Google Scholar]
- 5.Wong J.K., Tan H.K., Lau S.Y., Yap P., Danquah M.K. Potential and challenges of enzyme incorporated nanotechnology in dye wastewater treatment: a review. J. Environ. Chem. Eng. 2019;7(4) doi: 10.1016/j.jece.2019.103261. [DOI] [Google Scholar]
- 6.Ahmed J., Rahman M.M., Siddiquey I.A., Asiri A.M., Hasnat M.A. Efficient hydroquinone sensor based on zinc, strontium and nickel based ternary metal oxide (TMO) composites by differential pulse voltammetry. Sens. Actuators. B. Chem. 2018;256:383–392. doi: 10.1016/j.snb.2017.10.076. [DOI] [Google Scholar]
- 7.Zhang H., Ling Z., Ma J., Nie Y. Biodegradability enhancement of phenolic wastewater using hydrothermal pretreatment. Bioresour. Technol. 2023;367(128199) doi: 10.1016/j.biortech.2022.128199. [DOI] [PubMed] [Google Scholar]
- 8.Chen T., Zeng Q., Cao M., Zhang L., Adyari B., Ma C., et al. Fate of contaminants of emerging concern in two wastewater treatment plants after retrofitting tertiary treatment for reduction of nitrogen discharge. Environ. Res. 2024;118344 doi: 10.1016/j.envres.2024.118344. [DOI] [PubMed] [Google Scholar]
- 9.Kavian N., Asadollahfardi G., Hasanbeigi A., Delnavaz M., Samadi A. Degradation of phenol in wastewater through an integrated dielectric barrier discharge and Fenton/Photo-Fenton process. Ecotoxicol. Environ. Saf. 2024;271(115937) doi: 10.1016/j.ecoenv.2024.115937. [DOI] [PubMed] [Google Scholar]
- 10.Jiménez-Bambague E.M., Madera-Parra C.A., Rangel-Delgado M.F., Quintero-Martinez I., Miranda-Mosquera D., Aristizabal-Apolinar J.S., et al. Photo-Fenton and Electro-Fenton performance for the removal of pharmaceutical compounds in real urban wastewater. Electrochim. Acta. 2023;442(141905) doi: 10.1016/j.electacta.2023.141905. [DOI] [Google Scholar]
- 11.Rizzo L., Malato S., Antakyali D., Beretsou V.G., Đolić M.B., Gernjak W., et al. Consolidated vs new advanced treatment methods for the removal of contaminants of emerging concern from urban wastewater. Sci. Total Environ. 2019;655:986–1008. doi: 10.1016/j.scitotenv.2018.11.265. [DOI] [PubMed] [Google Scholar]
- 12.Montes R., Méndez S., Cobas J., Carro N., Neuparth T., Alves N., et al. Occurrence of persistent and mobile chemicals and other contaminants of emerging concern in Spanish and Portuguese wastewater treatment plants, transnational river basins and coastal water. Sci. Total Environ. 2023;885(163737) doi: 10.1016/j.scitotenv.2023.163737. [DOI] [PubMed] [Google Scholar]
- 13.Feijoo S., Kamali M., Dewil R. A review of wastewater treatment technologies for the degradation of pharmaceutically active compounds: carbamazepine as a case study. Chem. Eng. J. 2023;455(140589) doi: 10.1016/j.cej.2022.140589. [DOI] [Google Scholar]
- 14.Adeoye J.B., Tan Y.H., Lau S.Y., Tan Y., Chiong T., Mubarak N.M., et al. Advanced oxidation and biological integrated processes for pharmaceutical wastewater treatment: a review. J. Environ. Manage. 2024;353(120170) doi: 10.1016/j.jenvman.2024.120170. [DOI] [PubMed] [Google Scholar]
- 15.Xavier S., Gandhimathi R., Nidheesh P.V., Ramesh S.T. Comparison of homogeneous and heterogeneous Fenton processes for the removal of reactive dye Magenta MB from aqueous solution. Desalination Water Treat. 2015;53(1):109–118. doi: 10.1080/19443994.2013.844083. [DOI] [Google Scholar]
- 16.Baba Y., Yatagai T., Harada T., Kawase Y. Hydroxyl radical generation in the photo-Fenton process: effects of carboxylic acids on iron redox cycling. Chem. Eng. J. 2015;277:229–241. doi: 10.1016/j.cej.2015.04.103. [DOI] [Google Scholar]
- 17.Espinoza-Montero P.J., Vasquez-Medrano R., Ibanez J.G., Frontana-Uribe B.A. Efficient anodic degradation of phenol paired to improved cathodic production of H2O2 at BDD electrodes. J. Electrochem. Soc. 2013;160(7):3171–3177. doi: 10.1149/2.027307jes. [DOI] [Google Scholar]
- 18.Monserrat-Castañeda J., Castillo-Suáreza L., Linares-Hernándeza I., Avendaño-Sanjuanb F. Editorial Universidad Autónoma del Estado de México; México: 2020. Procesos Fenton en el tratamiento de aguas; pp. 201–217.http://hdl.handle.net/20.500.11799/109361 [Consultado el 22 de febrero de 2024] [Google Scholar]
- 19.Ribeiro J.P., Gomes H.G.M.F., Sarinho L., Marqués C.C., Nunes M.I. Synergies of metallic catalysts in the Fenton and photo-Fenton processes applied to the treatment of pulp bleaching wastewater. Chem. Eng. Process. 2022;181(109159) doi: 10.1016/j.cep.2022.109159. [DOI] [Google Scholar]
- 20.Rahim-Pouran S., Abdul-Aziz A.R., Wan Daud W.M.A. Review on the main advances in photo-Fenton oxidation system for recalcitrant wastewaters. J. Ind. Eng. Chem. 2015;21:53–69. doi: 10.1016/j.jiec.2014.05.005. [DOI] [Google Scholar]
- 21.Lucas M.S., Peres J.A. Removal of COD from olive mill wastewater by Fenton's reagent: kinetic study. J. Hazard Mater. 2009;168(2–3):1253–1259. doi: 10.1016/j.jhazmat.2009.03.002. [DOI] [PubMed] [Google Scholar]
- 22.Oller I., Malato S. Photo-Fenton applied to the removal of pharmaceutical and other pollutants of emerging concern. Curr. Opin. Green. Sustain. Chem. 2021;29(100458) doi: 10.1016/j.cogsc.2021.100458. [DOI] [Google Scholar]
- 23.Clarizia L., Russo D., Di-Somma I I., Marotta R., Andreozzi R. Homogeneous photo-Fenton processes at near neutral pH: a review. Appl. Catal., B. 2017;209:358–371. doi: 10.1016/j.apcatb.2017.03.011. [DOI] [Google Scholar]
- 24.di Luca C., Garcia J., Ortiz D., Muñoz M., Carbajo J., De Pedro Z.M., Casas J. Mineralization of polystyrene nanoplastics in yan by photo-Fenton oxidation. J. Environ. Chem. Eng. 2023;11(5) doi: 10.1016/j.jece.2023.110755. [DOI] [Google Scholar]
- 25.Harris G.D., Adams V.D., Sorensen D.L., Curtis M.S. Ultraviolet inactivation of selected bacteria and viruses with photoreactivation of the bacteria. Water Res. 1987;21(6):687–692. doi: 10.1016/0043-1354(87)90080-7. [DOI] [Google Scholar]
- 26.Pignatello J.J., Oliveros E. A. MacKay. Advanced oxidation processes for organic contaminant destruction base on the fenton reaction and related chemistry. Crit. Rev. Environ. Sci. Technol. 2006;36(1):1–84. doi: 10.1080/10643380500326564. [DOI] [Google Scholar]
- 27.Martin del Campo E., Romero R., Roa G., Peralta-Reyes E., Espino-Valencia J., Natividad R. Photo-Fenton oxidation of phenolic compounds catalyzed by iron-PILC. Fuel. 2014;138:149–155. doi: 10.1016/j.fuel.2014.06.014. [DOI] [Google Scholar]
- 28.Gilpavas E. Universidad Nacional de Colombia; Manizales, Colombia: 2020. Procesos Avanzados de Oxidación para la degradación de índigo y materia orgánica de aguas Residuales de una Industria textil [Tesis doctoral]https://repositorio.unal.edu.co/handle/unal/78505 [Google Scholar]
- 29.Lei Y., Hou J., Fang C., Tian Y., Naidu R., Zhang J., et al. Ultrasound-based advanced oxidation processes for landfill leachate treatment: energy consumption, influences, mechanisms and perspectives. Ecotoxicol. Environ. Saf. 2023;263(115366) doi: 10.1016/j.ecoenv.2023.115366. [DOI] [PubMed] [Google Scholar]
- 30.Rad L.R., Irani M., Divsar F., Pourahmad H., Sayyafan M.S., Haririan I. Simultaneous degradation of phenol and paracetamol during photo-Fenton process: design and optimization. J. Taiwan Inst. Chem. Eng. 2015;47:190–196. doi: 10.1016/j.jtice.2014.10.014. [DOI] [Google Scholar]
- 31.Faggiano A., De Carluccio M., Fiorentino A., Ricciardi M., Cucciniello R., Proto A., et al. Photo-Fenton like process as polishing step of biologically co-treated olive mill wastewater for phenols removal. Sep. Purif. Technol. 2023;305(122525) doi: 10.1016/j.seppur.2022.122525. [DOI] [Google Scholar]
- 32.Carvalho-Neves L., Beber de Souza J., de Souza-Vidal C., Herbert L.T., de Souza K.V., Geronazzo-Martins K., et al. Phytotoxicity indexes and removal of color, COD, phenols and ISA from pulp and paper mill wastewater post-treated by UV/H2O2 and photo-Fenton. Ecotoxicol. Environ. Saf. 2020;202(110939) doi: 10.1016/j.ecoenv.2020.110939. [DOI] [PubMed] [Google Scholar]
- 33.Yıldız S., Şentürk I., Canbaz G.T. Degradation of phenol and 4-chlorophenol from aqueous solution by Fenton, photo-Fenton, sono-Fenton, and sono-photo-Fenton methods. J. Iran. Chem. Soc. 2023;20(1):231–237. doi: 10.1007/s13738-022-02663-z. [DOI] [Google Scholar]
- 34.Tejera J., Hermosilla A., Gascó R., Miranda V., Alonso V., Negro C., et al. Treatment of mature landfill leachate by electrocoagulation followed by Fenton or UVA-LED photo-Fenton processes. J. Taiwan Inst. Chem. Eng. 2021;119:33–44. doi: 10.1016/j.jtice.2021.02.018. [DOI] [Google Scholar]
- 35.Çiner F., Gökkuş Ö. Treatability of dye solutions containing disperse dyes by Fenton and Fenton‐solar light oxidation processes. Clean. 2013;41(1):80–85. doi: 10.1002/clen.201000500. [DOI] [Google Scholar]
- 36.Gökkuş Ö., Çoşkun F., Kocaoğlu M., Yıldız Y.Ş. Determination of optimum conditions for color and COD removal of Reactive Blue 19 by Fenton oxidation process. Desalination Water Treat. 2014;52(31–33):6156–6165. doi: 10.1080/19443994.2013.812523. [DOI] [Google Scholar]
- 37.Montgomery D.C. eighth ed. John Wiley & Sons; 2019. Design and Analysis of Experiments.https://industri.fatek.unpatti.ac.id/wp-content/uploads/2019/03/181-Design-and-Analysis-of-Experiments-Douglas-C.-Montgomery-Edisi-8-2013.pdf [Consultado el 22 de febrero de 2024] [Google Scholar]
- 38.Trigueros D.E.G., Braun L., Hinterholz C.L. Environmental and economic feasibility of the treatment of dairy industry wastewater by photo-Fenton and electrocoagulation process: multicriteria optimization by desirability function. J. Photochem Photobiol A. Chem. 2022;427(113820) doi: 10.1016/j.jphotochem.2022.113820. [DOI] [Google Scholar]
- 39.Thomas O., Thomas M.F. 2022. Industrial wastewater. In: UV-Visible Spectrophotometry of Waters and Soils (Third Edition). Elsevier; pp. 385–416. [DOI] [Google Scholar]
- 40.Raffo-Lecca E., Ruiz-Lizama E. Caracterización de las aguas residuales y la demanda bioquímica de oxígeno. Datos industriales. 2014;17(1):71–80. https://www.redalyc.org/articulo.oa?id=81640855010 [Google Scholar]
- 41.Radziff S.B.M., Ahmad S.A., Shaharuddin N.A., Merican F., Kok Y.Y., Zulkharnain A., et al. Potential application of algae in biodegradation of phenol: a review and bibliometric study. Plants. 2021;10(12):2677. doi: 10.3390/plants10122677. [DOI] [PMC free article] [PubMed] [Google Scholar]
- 42.Mohammadi S., Kargari A., Sanaeepur H., Abbassian K., Najafi A., Mofarrah E. Phenol removal from industrial wastewaters: a short review. Desalination Water Treat. 2015;53(8):2215–2234. doi: 10.1080/19443994.2014.883327. [DOI] [Google Scholar]
- 43.Devi L.G., Munikrishnappa C., Nagaraj B., Rajashekhar K.E. Effect of chloride and sulfate ions on the advanced photo Fenton and modified photo Fenton degradation process of Alizarin Red S. J. Mol. Catal. A. Chem. 2013;374–375:125–131. doi: 10.1016/j.molcata.2013.03.023. [DOI] [Google Scholar]
- 44.Titchou F.E., Zazou H., Afanga H., Jamila E.G., Ait Akbour R., Hamdani M., et al. Comparative study of the removal of direct red 23 by anodic oxidation, electro-Fenton, photo-anodic oxidation and photoelectro-Fenton in chloride and sulfate media. Environ. Res. 2022;204(112353) doi: 10.1016/j.envres.2021.112353. [DOI] [PubMed] [Google Scholar]
- 45.Sierra-Ramírez C. Calidad del agua, Evaluación y Diagnostico [Internet]. Bogotá, Colombia: Universidad de Medellín. 2011. http://hdl.handle.net/11407/2568 [Consultado 2024 abril 25]
- 46.Babu-Ponnusami A., Sinha S., Ashokan H., Paul M.V., Hariharan S.P., Arun J., et al. Advanced Oxidation Process (AOP) combined biological process for wastewater treatment: a review on advancements, feasibility and practicability of combined techniques. Environ. Res. 2023;237(116944) doi: 10.1016/j.envres.2023.116944. [DOI] [PubMed] [Google Scholar]
- 47.Villota N., Lomas J.M., Camarero L.M. Study of the paracetamol degradation pathway that generates color and turbidity in oxidized wastewaters by photo-Fenton technology. J. Photochem. Photobiol. A. Chem. 2016;329:113–119. doi: 10.1016/j.jphotochem.2016.06.024. [DOI] [Google Scholar]
- 48.Santos C., Herraiz-Carboné M., Lacasa E., Sáez C., Montes R., Benito-Quintana J., et al. Continuous-flow titration of low iron doses to promote photo-Fenton and photo-Fenton-like processes at neutral pH. Chem. Eng. J. 2023;476(146655) doi: 10.1016/j.cej.2023.146655. [DOI] [Google Scholar]
- 49.Silva G.D., Marson E.O., Batista L.L., Ueira-Vieira C., Starling M., Trovó A.G. Contrasting the performance of photo-Fenton at neutral pH in the presence of different organic iron-complexes using hydrogen peroxide or persulfate as oxidants for naproxen degradation and removal of antimicrobial activity. Process Saf. Environ Prot. 2021;147:798–807. doi: 10.1016/j.psep.2021.01.005. [DOI] [Google Scholar]
- 50.López-Vinent N., Cruz-Alcalde A., Gutiérrez C., Marco P., Giménez J., Esplugas S. Micropollutant removal in real WW by photo-Fenton (circumneutral and acid pH) with BLB and LED lamps. Chem. Eng. J. 2020;379(122416) doi: 10.1016/j.cej.2019.122416. [DOI] [Google Scholar]
- 51.Liu Y., Zhou H., Wei K., He C., Du Y., Liu Y., et al. Extending semiconductor-based photo-fenton reaction to circumneutral pH using chelating agents: the overlooked role of pH on the reduction mechanism of Fe3+ Chem. Eng. J. 2022;450(138109) doi: 10.1016/j.cej.2022.138109. [DOI] [Google Scholar]
- 52.Vallés I., Sciscenko I., Mora M., Micó P., Amat A.M., Santos-Juanes L., et al. On the relevant role of iron complexation for the performance of photo-Fenton process at mild pH: role of ring substitution in phenolic ligand and interaction with halides. Appl. Catal., B. 2023;331(122708) doi: 10.1016/j.apcatb.2023.122708. [DOI] [Google Scholar]
- 53.Huang L.Z., Zhu M., Liu Z., Wang Z., Hansen H.C.B. Single sheet iron oxide: an efficient heterogeneous electro-Fenton catalyst at neutral pH. J. Hazard Mater. 2019;364:39–47. doi: 10.1016/j.jhazmat.2018.10.026. [DOI] [PubMed] [Google Scholar]
- 54.Liao C.H., Gurol M.D. Chemical oxidation by photolytic decomposition of hydrogen peroxide. Environ. Sci. Technol. 1995;29(12):3007–3014. doi: 10.1021/es00012a018. [DOI] [PubMed] [Google Scholar]
- 55.de Luna M.D.G., Colades J.I., Su C.C., Lu M.C. Comparison of dimethyl sulfoxide degradation by different Fenton processes. Chem. Eng. J. 2013;232:418–424. doi: 10.1016/j.cej.2013.07.107. [DOI] [Google Scholar]
- 56.Sánchez-Montes I., Salmerón-García I., Rivas-Ibañez G., Aquino J.M., Polo-López M.I., Malato S., et al. UVC-based adanced oxidation processes for simultaneous removal of microcontaminants and pathogens from simulated municipal wastewater at pilot plant scale. Environ. Sci. 2020;6(9):2553–2566. doi: 10.1039/d0ew00279h. [DOI] [Google Scholar]
- 57.Bratby J. Coagulation and flocculation in wáter a wastewater treatment – third edition. Water Intell. Online. 2015;5(0) doi: 10.2166/9781780402321. 9781780402321–9781780402321. [DOI] [Google Scholar]
- 58.Gürses A., Yalçin M., Doğar C. Electrocoagulation of some reactive dyes: a statistical investigation of some electrochemical variables. Waste Manag. 2002;22(5):491–499. doi: 10.1016/s0956-053x(02)00015-6. [DOI] [PubMed] [Google Scholar]
- 59.Wang L., Jiang X. Unusual catalytic effects of iron salts on phenol degradation by glow discharge plasma in aqueous solution. J. Hazard Mater. 2009;161(2–3):926–932. doi: 10.1016/j.jhazmat.2008.04.037. [DOI] [PubMed] [Google Scholar]
- 60.Do S.H., Batchelor B., Lee H.K., Kong S.H. Hydrogen peroxide decomposition on manganese oxide (pyrolusite): kinetics, intermediates, and mechanism. Chemosphere. 2009;75(1):8–12. doi: 10.1016/j.chemosphere.2008.11.075. [DOI] [PubMed] [Google Scholar]
- 61.Poblete R., Bakit J. Technical and economical assessment of the treatment of vinasse from Pisco production using the advanced oxidation process. Environ. Sci. Pollut. Res. Int. 2023;30(27):70213–70228. doi: 10.1007/s11356-023-27390-7. [DOI] [PubMed] [Google Scholar]
Associated Data
This section collects any data citations, data availability statements, or supplementary materials included in this article.
Supplementary Materials
Data Availability Statement
All data generated or analyzed during this study are included within the article.