
Fig. 3.
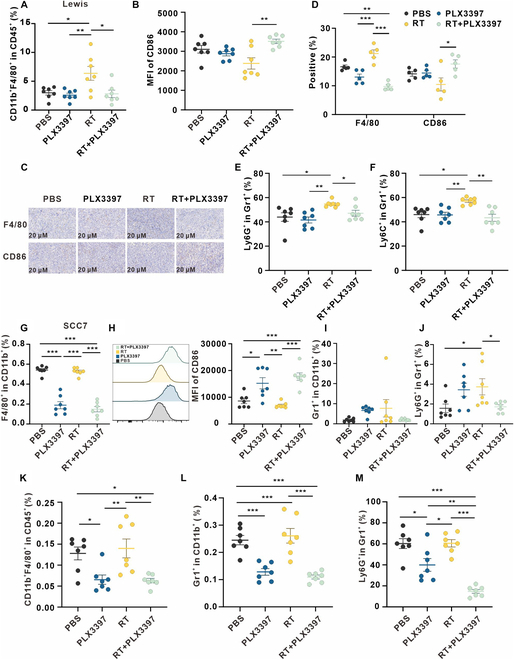
Early blockade of the MCSF pathway promotes macrophage polarization toward M1 phenotype and reduces MDSCs. (A and B) Flow cytometry analysis depicting alterations in macrophages within the Lewis subcutaneous tumor across various treatment groups (n = 7 per group). (C) Representative immunohistochemical staining of Lewis subcutaneous tumors in corresponding groups. (D) Five fields were randomly selected from 3 replicates for each group, and the percentage of staining positive area was counted. (E and F) MDSCs in Lewis subcutaneous tumors in corresponding treatment groups were analyzed using flow cytometry (n = 7 per group). (G to J) Myeloid cells in SCC7 subcutaneous tumor in corresponding treatment groups (n = 7 per group) were analyzed using flow cytometry. (K to M) Myeloid cells in the spleen of SCC7 subcutaneous transplant tumor model in corresponding treatment (n = 7 per group) were analyzed using flow cytometry.