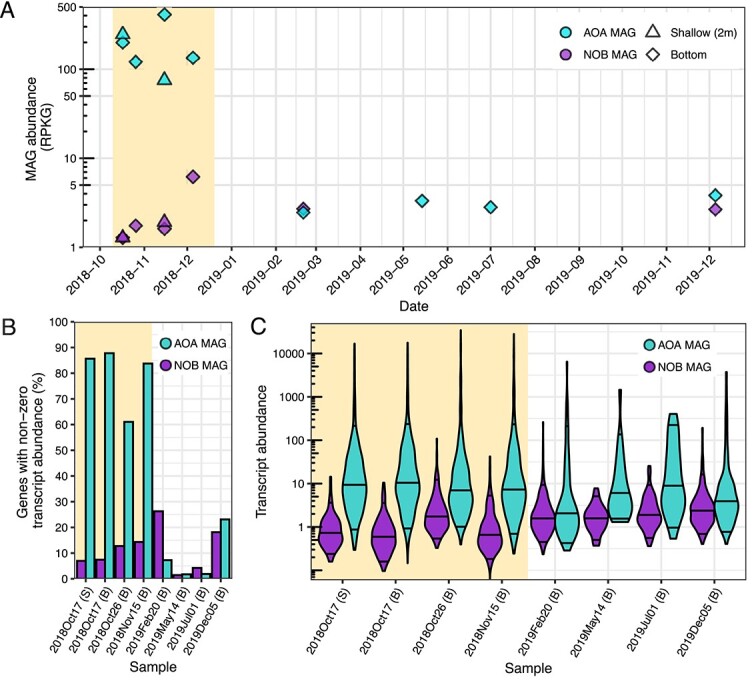
Figure 2.

(A) Top panels show the relative abundance in RPKG for the AOA and NOB MAGs over time. (B) Bottom-left panel shows the percentage of genes identified using prodigal in the AOA and NOB MAG that have nonzero transcript abundance at a given time point. (C) Bottom-right panel shows transcript abundance for all genes with nonzero transcript abundance in the AOA and NOB MAGs. Violin plots are a constant width with the 50%, 5%, and 95% quantiles indicated by horizontal lines. Violins are trimmed to the range of data. Highlighted areas indicate the AOA bloom samples in all three panels.
