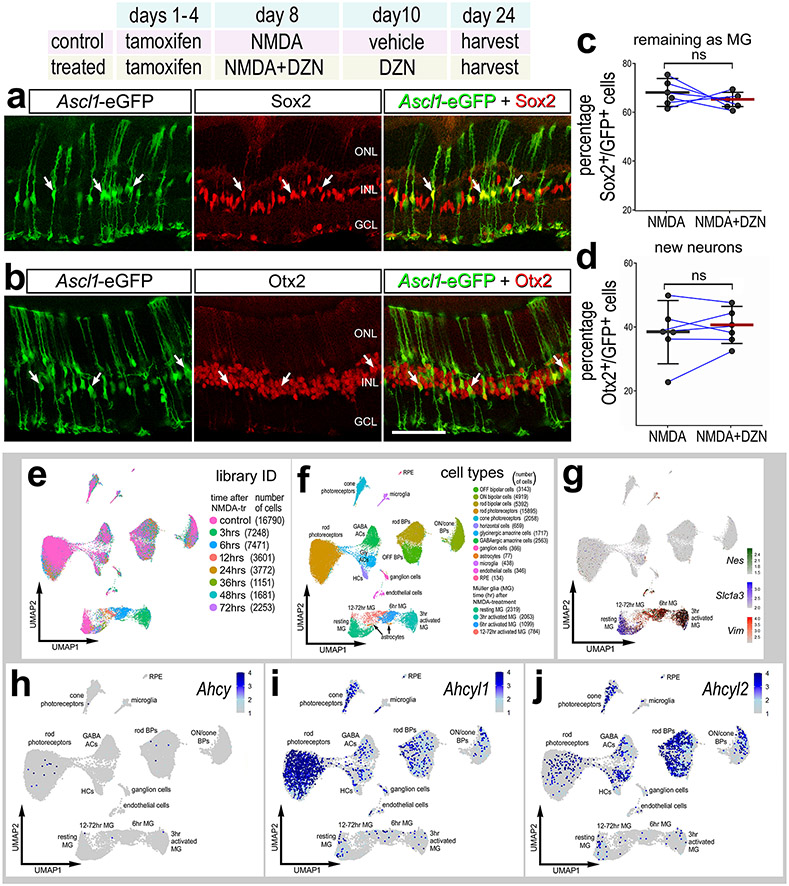
Figure 10. SAHH inhibitor has no effect upon the differentiation of neurons from Ascl1-overexpressing MG in the mouse retina.
(a-d) Tamoxifen was administered IP 1x daily for 4 consecutive days to Glast-CreER:LNL-tTA:tetO-mAscl1-ires-GFP mice. NMDA was injected intravitreally in left (control) eyes and NMDA + DZN in right (treated) eyes on D8, vehicle ± DZN on D9, vehicle ± DZN on D10, and retinas were harvested 2 weeks after the last injection. Retinal sections were labeled for GFP (green), and Sox2 (red; a) or Otx2 (red; b). Arrows in a and b indicate cells double-labeled for GFP and Sox2 or Otx2. Histograms represent the mean (bar±SD) and each dot represents one biological replicate (blue lines connect control and treated eyes from the same individual) for GFP+ cells that are Sox2+ (c) or Otx2+ (d). Significance of difference (p-values shown) was determined by using a Mann-Whitney U test. The calibration bar in b represents 50 μm. Abbreviations: ONL, outer nuclear layer; INL, inner nuclear layer; GCL, ganglion cell layer. Ahcy, Ahcyl1 and Ahcyl2 in normal and damaged mouse retinas (e-j). UMAP plots of aggregated scRNA-seq libraries prepared from control retinas and retinas 3, 6, 12, 24, 36, 48, and 72 hours after NMDA damage; numbers of cells per library or per cluster in parentheses (e). Clusters of different types of retinal cells were identified based on collective expression of different cell-distinguishing markers as described in the Materials and Methods (f). Resting MG and reactive MG identified by expression of Slc1a3 or Nes and Vim, respectively (g). UMAP heatmap plots illustrate patterns and expression levels of Ahcy, Ahcyl1 and Ahcyl2 across all retinal cells (h-j).

