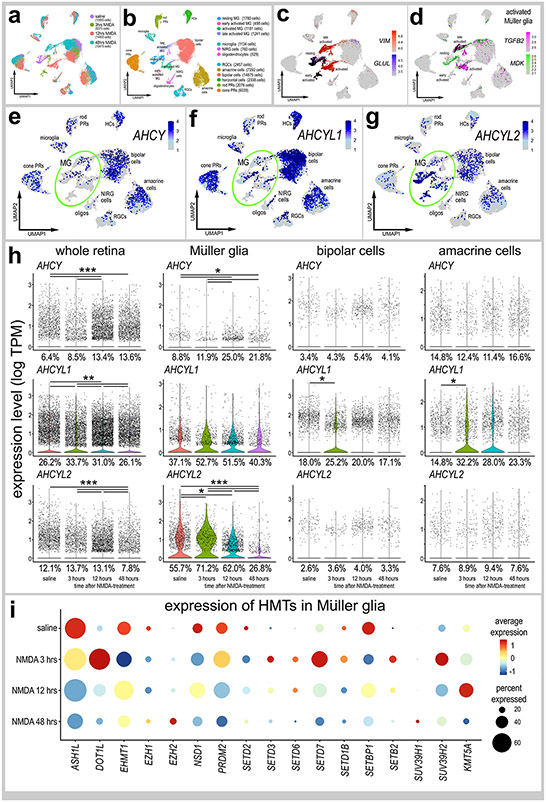
Figure 3. Patterns of expression of ACHY, ACHYL1 and ACHYL2 in normal and damaged retinas.
scRNA-seq was used to identify patterns and levels of expression of ACHY, ACHYL1, AHCYL2 and HMTs in control and NMDA-damaged retinas at 3, 12 and 48 hours after treatment (a). UMAP clusters of cells were identified based on well-established patterns of gene expression (see Methods; b). MG were identified by expression of VIM and GLUL in resting MG (c), and TGFB2 and MDK activated MG (d). Each dot represents one cell and black dots indicate cells that express 2 or more genes (c-d). The violin plots in h illustrate the expression levels and percent expressing cells for ACHY, ACHYL1 and AHCYL2 whole retina, Müller glia, bipolar cells and amacrine cells in control and NMDA-damaged retinas at 3, 12 and 48 hours after treatment. The dot plot in i illustrates average expression (heatmap) and percent expressed (dot size) for different HMTs in MG that are significantly (p<0.01) up- or downregulated at different times following NMDA-treatment. Significant of difference (*p<0.01, **p<10−10, ***p<10−20) was determined by using a Wilcox rank sum test with Bonferroni correction.

