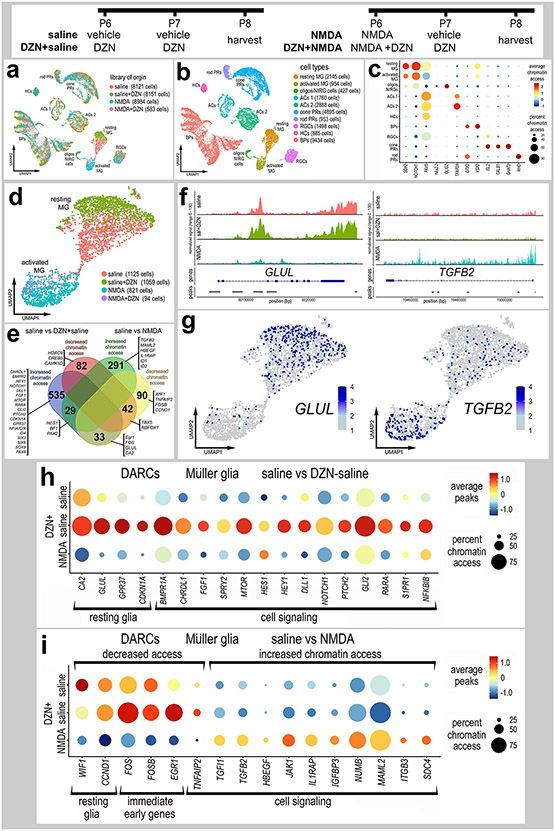
Figure 5. Treatment of retinas with SAHH inhibitor influences chromatin access in MG.
Eyes were injected with saline ± DZN or NMDA ± DZN, retinas were harvested 24hrs after the last injection and scATAC-seq libraries were generated (a). UMAP plots were generated and clusters of cells identified based on chromatin access for genes known to be associated with retinal cell types (b,c). Genes with enhanced chromatin access in distinct cells types included GNAT2 (cone PRs), ISL2 and POU4F2 (RGCs), VSX2 (bipolar cells), PAX6 (amacrine and horizontal cells), TFAP2A (amacrine cells), and illustrated in a dot plot (c). MG were isolated and re-ordered in UMAP plots (d). UMAP clusters of MG formed for resting MG (saline and saline+DZN-treated cells) and activated MG (NMDA and NMDA+DZN-treated cells) (d). Lists of genes with differential accessible chromatin regions (DACRs; supplemental tables 2 and 3) were generated and a The Venn diagram (e) constructed to illustrate numbers of genes with significantly up- and down-regulated chromatin access according to treatment. Significance of difference (p<0.05) was determined by using a Wilcox rank sum test with Bonferroni correction. Clusters or resting and activated MG were distinguished based on differential chromatin access to genes such as GLUL, TGFB2 (f,g), EGR1, FOSB, FOS, CDKN1A and HEYL (h,i).

